
FRL DEEP RESEARCH

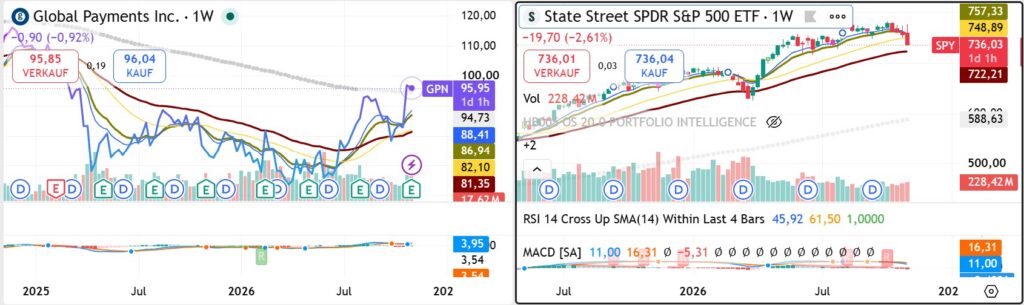
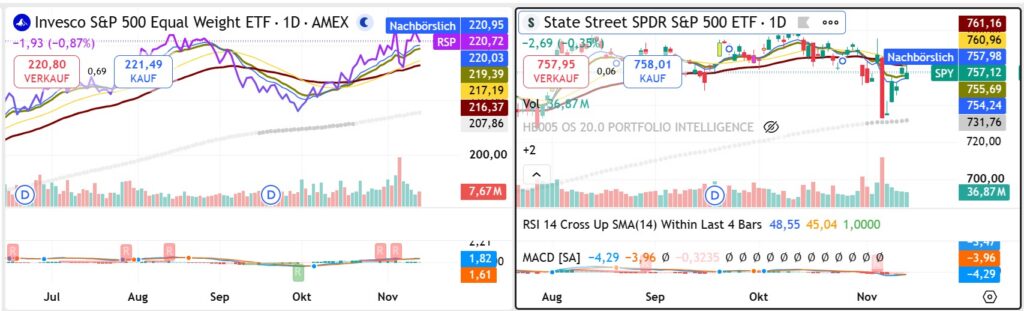
TradingView RSP/SPY relative strength chart comparing equal-weight and market-cap-weighted S&P 500 performance during November 2026, illustrating market breadth and sector rotation risk.

Rising Yields and Sector Rotation: The Risk-Migration Test

Nvidia, Rising Yields and Sector Rotation: The Risk-Migration Test Why the next phase of the market may reward confirmation over conviction FRL DEEP RESEARCHFinal Resurrection Limited | TITAN Options CircleMarket Strategy Research | November 12, 2026 The departure of Nvidia’s founder has exposed a deeper market question: is capital broadening into a healthier bull market,

Rising Yields and Sector Rotation: The Risk-Migration Test Read More »
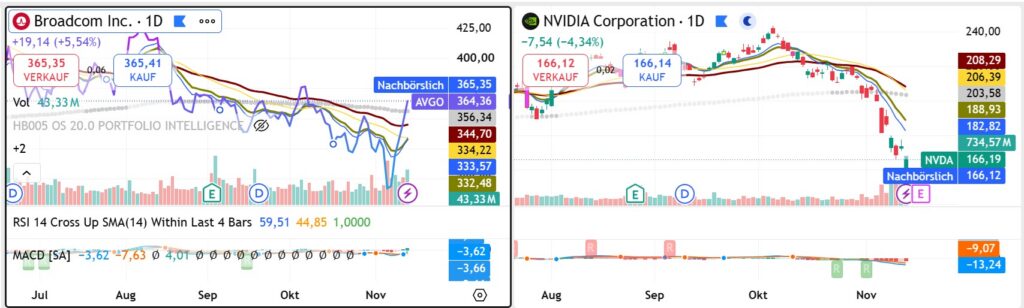
TradingView relative-performance chart comparing Broadcom and NVIDIA following Jensen Huang's November 12, 2026 resignation, illustrating diverging semiconductor stock performance.

NVIDIA After Jensen Huang: Why Wall Street Is Splitting the AI Trade Rather Than Abandoning It

FRL DEEP RESEARCH | Market Intelligence | November 12, 2026 The departure of NVIDIA’s founder and CEO triggered a violent selloff, but the broader market’s response tells a more complicated story. Rival chipmakers gained, AI-financing beneficiaries weakened, and rising Treasury yields added pressure. The central question is whether the market is repricing leadership risk—or the

NVIDIA After Jensen Huang: Why Wall Street Is Splitting the AI Trade Rather Than Abandoning It Read More »

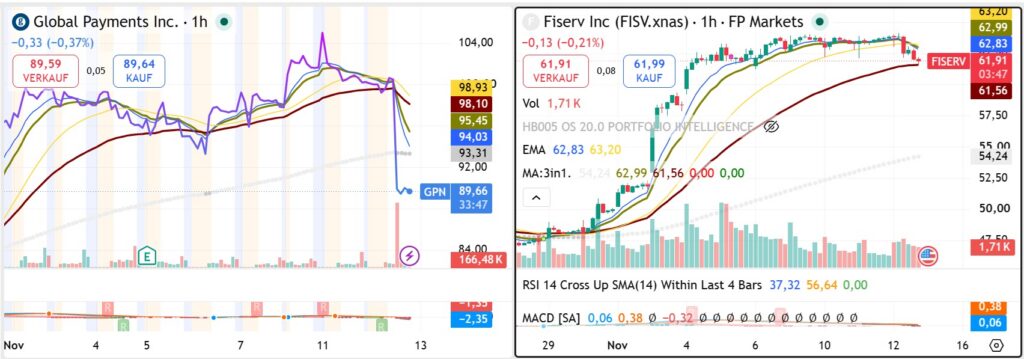
Global Payments share price relative to Fiserv during the October–November 2026 takeover speculation and subsequent selloff.

Global Payments: The Failed Buyout Exposes a $4 Billion Cash-Flow Test

Why Global Payments’ November 12, 2026 selloff is less about a withdrawn takeover than the company’s ability to convert Worldpay synergies, adjusted earnings and financial scale into sustainable cash for shareholders. FRL DEEP RESEARCHFinal Resurrection LimitedInvestment Research – Analytical Market Studies12 November 2026 | Research cut-off: approximately 20:50 CET The Real Question Is Not Why

Global Payments: The Failed Buyout Exposes a $4 Billion Cash-Flow Test Read More »

Global Payments GPN relative strength versus the S&P 500 during the November 2026 stock market sell-off.

Global Payments (GPN): A 7× Earnings Stock in a Market Sell-Off — or a Value Trap Hidden Behind a Takeover Rumour?

FRL DEEP RESEARCH | Analytical Market Study DECK: As Wall Street suffers a sharp sell-off, Global Payments appears unusually inexpensive relative to its earnings potential. But the investment case is complicated by the Worldpay integration, substantial debt, competing cash-flow measures and an unconfirmed takeover story. The crucial question is whether low valuation reflects opportunity or

Global Payments (GPN): A 7× Earnings Stock in a Market Sell-Off — or a Value Trap Hidden Behind a Takeover Rumour? Read More »

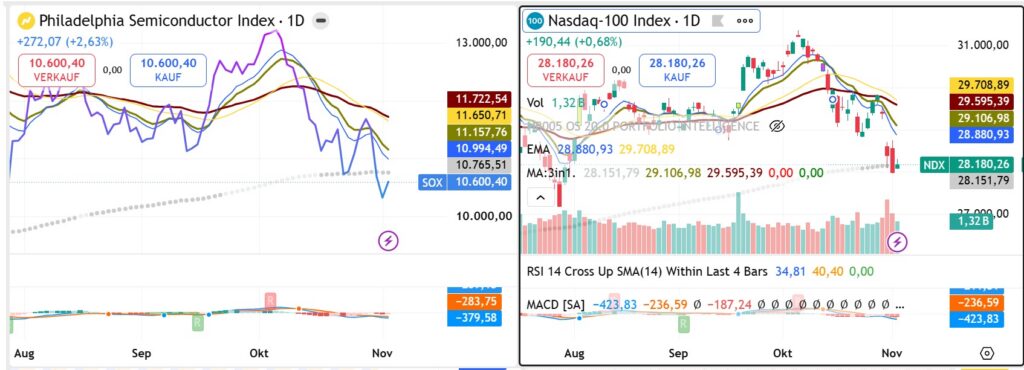
Semiconductor Index versus Nasdaq-100 relative strength chart examining market leadership and sector rotation after the 2026 U.S. midterm elections.

AFTER THE 2026 MIDTERMS: WHY A MARKET RECOVERY MAY NOT MEAN THE AI SELL-OFF IS OVER

The Hidden Divide Between Political Relief, Semiconductor Weakness and the Next Market Opportunity FRL DEEP RESEARCH November 4, 2026 | U.S. Equity Markets | Post-Election Strategy | Outlook Through Year-End THE INVESTMENT QUESTION The Democrats’ midterm sweep has lowered one kind of market risk while intensifying another. Falling Treasury yields may support broader equities, but

AFTER THE 2026 MIDTERMS: WHY A MARKET RECOVERY MAY NOT MEAN THE AI SELL-OFF IS OVER Read More »

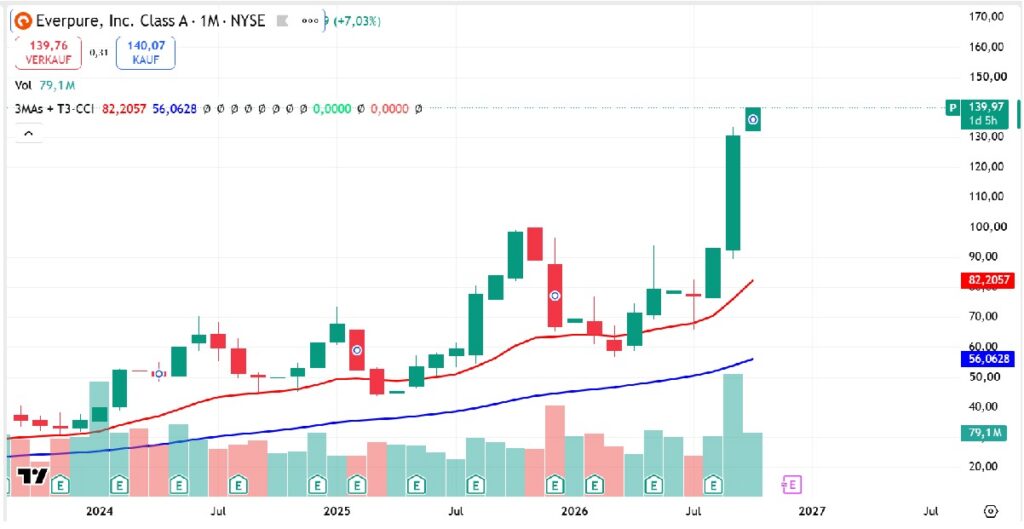
Everpure NYSE P share-price rally in 2026 compared with recent free cash flow and valuation concerns

Everpure Stock After a 100% Rally: Can the AI Storage Growth Story Still Justify Its Valuation Before Year-End 2026?

Analytical Market Study | October 29, 2026 | FRL DEEP RESEARCH Everpure’s accelerating revenue, expanding hyperscaler relationships and ambitious fiscal 2028 outlook have transformed its investment case. Yet a premium valuation, negative quarterly free cash flow and changing product economics create an important distinction: exceptional business growth does not automatically translate into attractive near-term shareholder

Everpure Stock After a 100% Rally: Can the AI Storage Growth Story Still Justify Its Valuation Before Year-End 2026? Read More »

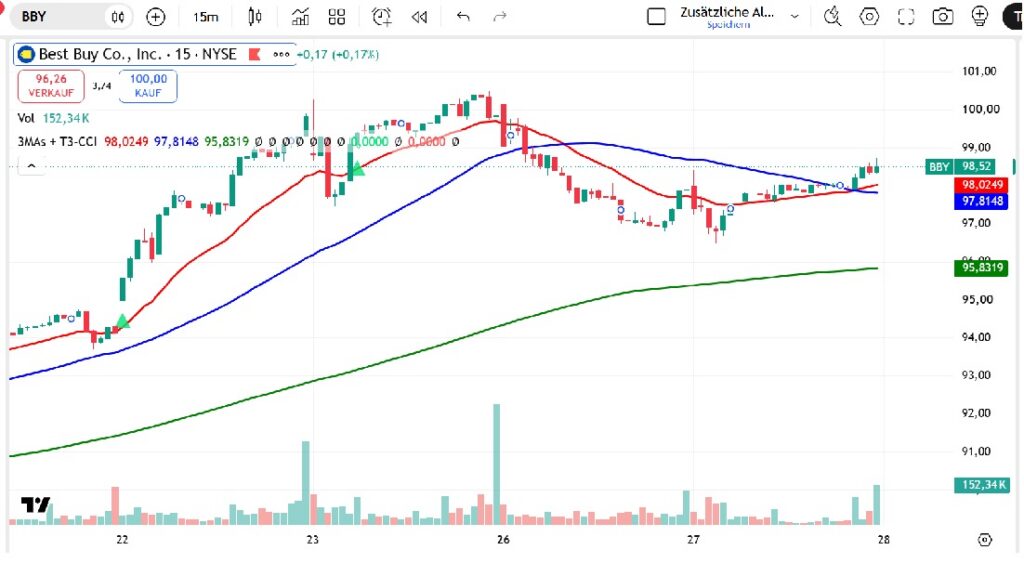
Best Buy (NYSE:BBY) 15-minute stock chart illustrating a conditional buy-limit entry near a previous trading low ahead of the October 2026 Federal Reserve decision.

Fed and Earnings Trading Strategy: The Hidden Risk in Conditional Orders

FRL DEEP RESEARCH | Final Resurrection Limited & TITAN Options Circle 28 October 2026 | Research & Strategy Discussions DECK The Federal Reserve decision and a concentrated earnings calendar present opportunities for disciplined event-driven trading. But the decisive advantage may not come from predicting market direction. It may come from understanding which orders execute, when

Fed and Earnings Trading Strategy: The Hidden Risk in Conditional Orders Read More »

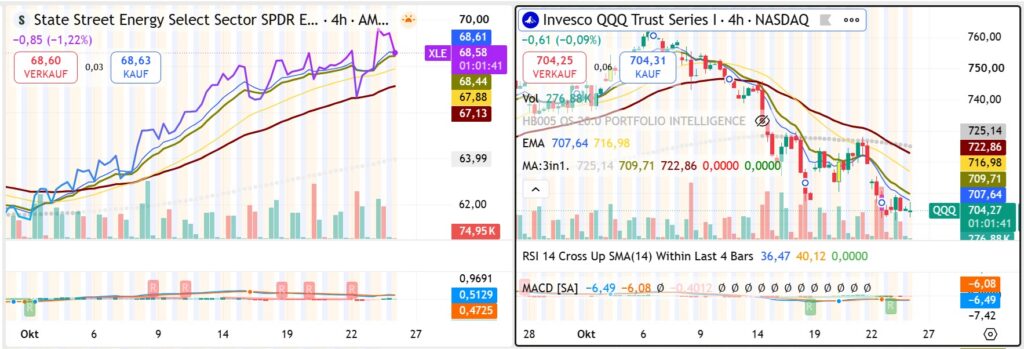
TradingView relative strength chart comparing US energy stocks (XLE) with the Nasdaq-100 (QQQ), highlighting October 2026 sector rotation and inflation-related market risks.

The Market’s Strongest Sector May Also Be Its Biggest Warning

The TITAN Weekly Market Strategy: Sector Rotation, AI Earnings, Inflation Risk and the Discipline of Waiting for Confirmation FRL DEEP RESEARCH | October 26, 2026 Category: FINAL RESURRECTION LTD & TITAN OPTIONS CIRCLE — Research & Strategy Discussions THE INVESTMENT THESIS Energy stocks are outperforming, technology leadership is deteriorating, and investors face an unusually concentrated

The Market’s Strongest Sector May Also Be Its Biggest Warning Read More »

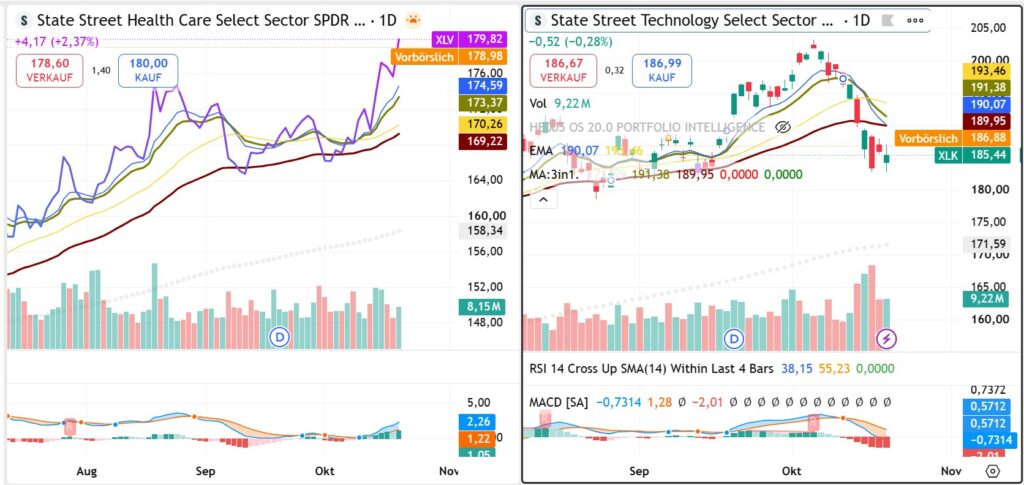
Healthcare-to-technology relative strength chart illustrating sector rotation and changing market leadership in October 2026.

Sector Rotation: How the New TITAN Market Traffic Light Detects Where Market Leadership Is Moving

The next opportunity may not be where the market is falling — but where leadership is quietly changing. FRL introduces a Sector Rotation Traffic Light that combines relative strength, absolute performance, market conditions and risk assessment to distinguish genuine opportunities from misleading signs of outperformance. The Market Can Change Leadership Without Changing Direction The most

Sector Rotation: How the New TITAN Market Traffic Light Detects Where Market Leadership Is Moving Read More »

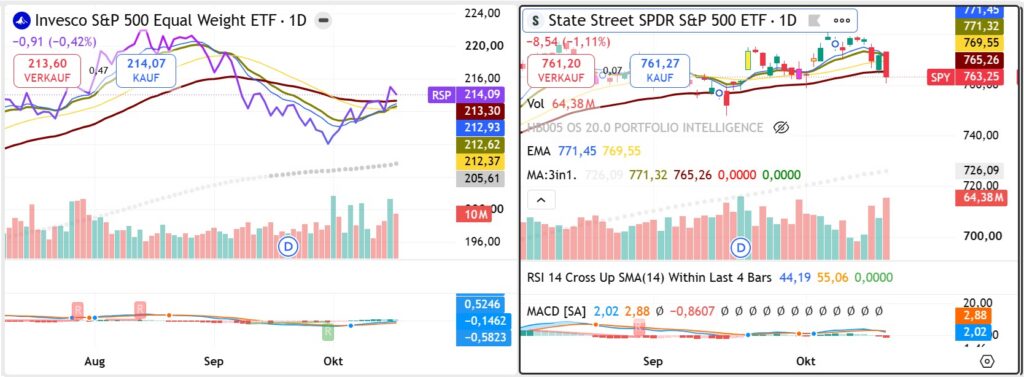
TradingView comparison of the equal-weighted S&P 500 ETF RSP and SPY, illustrating changes in US equity market leadership during the October 2026 technology correction.

Beyond Big Tech: Which Stock Market Sectors Offer the Strongest Investment Case as Technology Shares Decline?

By FRL DEEP RESEARCH Final Resurrection Limited | Investment Research Technology’s October correction is exposing a potentially important change in equity leadership. Energy infrastructure, consumer staples, insurance and selected defensive businesses are attracting attention. But the strongest investment case may not belong to the sector rising fastest. It may belong to businesses whose cash-flow economics

Beyond Big Tech: Which Stock Market Sectors Offer the Strongest Investment Case as Technology Shares Decline? Read More »