
FRL DEEP RESEARCH

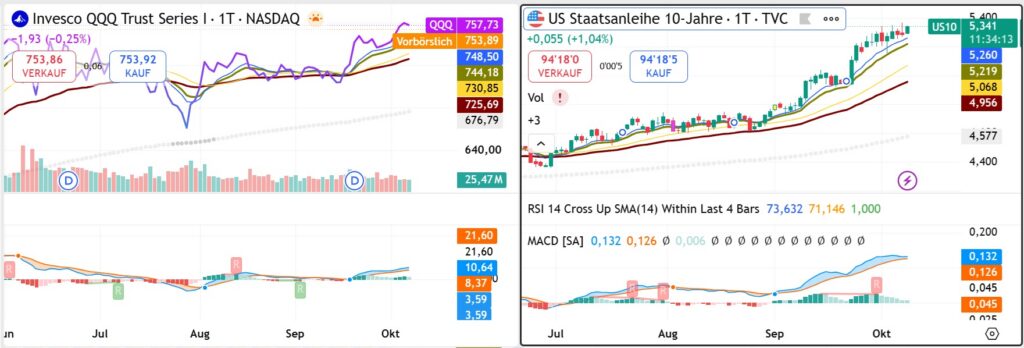
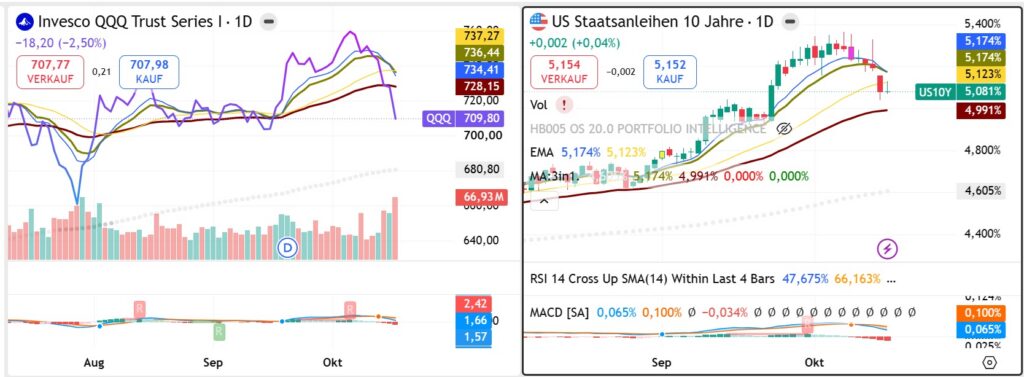
Nasdaq-100 QQQ compared with the US 10-year Treasury yield in October 2026, illustrating continued technology-stock weakness despite easing bond yields.

US Stock Market Sell-Off: How Long Has the Downturn Lasted, Why Is It Happening, and What Comes Next?

By FRL DEEP RESEARCH Final Resurrection Limited | Market Intelligence US equities have shifted from a broad technology-led advance into a more fragile market environment. Semiconductor weakness, rising Treasury yields and unusually restrained volatility suggest that the correction may be more significant than headline index movements imply. The coming week could determine whether this is
US Stock Market Sell-Off: How Long Has the Downturn Lasted, Why Is It Happening, and What Comes Next? Read More »

FRL Market Signals Library – Behind the Signals Development Journal #001. Financial market research featuring Wall Street forecasts, institutional research, stock market charts and historical market analysis from 2024 to 2026.

BEHIND THE SIGNALS — Development Journal

What If We Could Look Back at Wall Street’s Predictions — and See What Actually Happened? 14 October 2026 | Final Resurrection Limited Every day, major financial institutions publish market outlooks, investment opinions and economic forecasts. Goldman Sachs, Bloomberg, Reuters, Interactive Brokers and many others provide investors with a continuous stream of information. But there

BEHIND THE SIGNALS — Development Journal Read More »

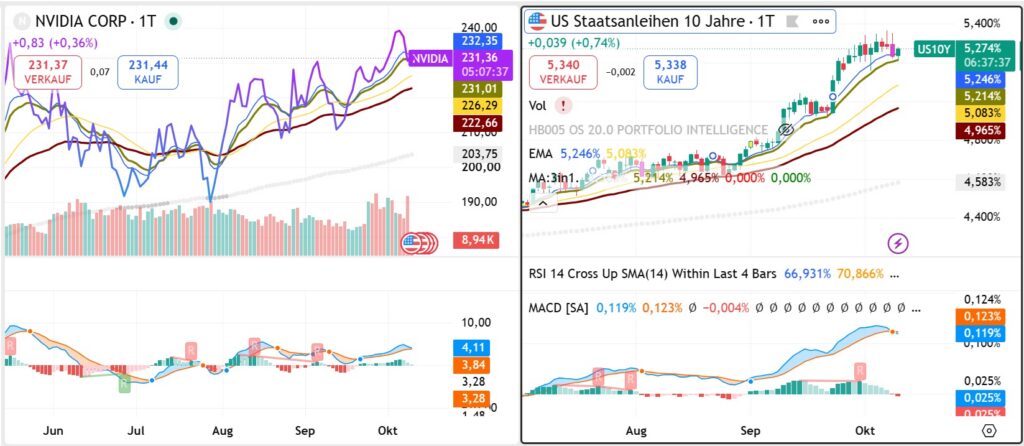
Nvidia stock price and US 10-year Treasury yield comparison illustrating financing risks facing the artificial intelligence infrastructure boom in October 2026.

The AI Boom’s $1.5 Trillion Financing Test: Why Nvidia’s Weakness May Be Warning of a Bigger Market Shift

Research & Strategy Discussions | 9 October 2026 | FRL DEEP RESEARCH The greatest risk to the artificial intelligence investment cycle may no longer be insufficient demand, but the widening gap between infrastructure investment, financing costs and cash generation. Nvidia’s weakness, resilient broad-market indices and elevated Treasury yields suggest that investors may be starting to

The AI Boom’s $1.5 Trillion Financing Test: Why Nvidia’s Weakness May Be Warning of a Bigger Market Shift Read More »

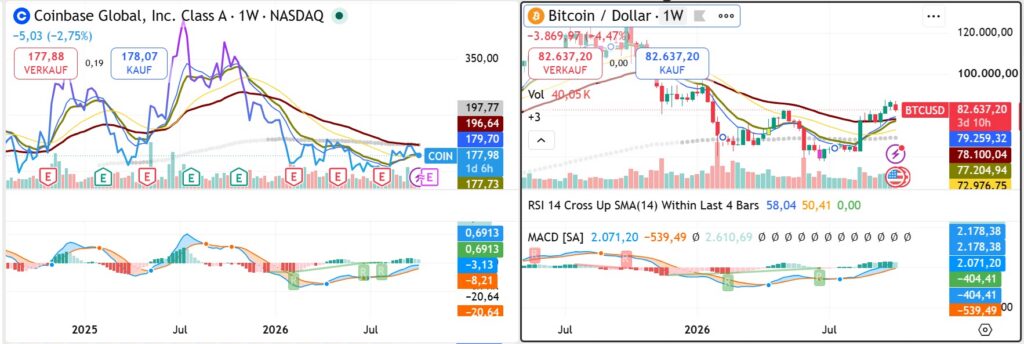
Coinbase versus Bitcoin relative-performance chart illustrating the gap between digital asset adoption and Coinbase shareholder returns in October 2026.

Coinbase (COIN): Buy the Infrastructure, or Sell the Crypto Cycle? The Hidden Variable Behind the Investment Case

Coinbase is gaining market share and expanding beyond cryptocurrency trading, yet its shares remain under pressure. The critical question is whether stablecoins, derivatives and financial infrastructure can create durable earnings independent of crypto-market cycles—or whether an overlooked dependence on interest rates undermines that transformation. The Investment Paradox: A Stronger Business Can Still Be a Weaker

Coinbase (COIN): Buy the Infrastructure, or Sell the Crypto Cycle? The Hidden Variable Behind the Investment Case Read More »

Nasdaq-100 ETF QQQ compared with the US 10-year Treasury yield in October 2026, illustrating technology-stock resilience despite rising bond yields.

The Rally That Refuses to Break: How Long Can Wall Street Defy the Bond Market?

TRACKING THE MARKETS | MARKET INTELLIGENCE | OCTOBER 8, 2026 – Wall Street’s technology rally is surviving a bond market that should be making life increasingly difficult for growth stocks. With Treasury yields above 5.3%, semiconductor leadership intact and volatility unusually subdued, the real question is whether investors are correctly anticipating extraordinary earnings growth—or underestimating

The Rally That Refuses to Break: How Long Can Wall Street Defy the Bond Market? Read More »

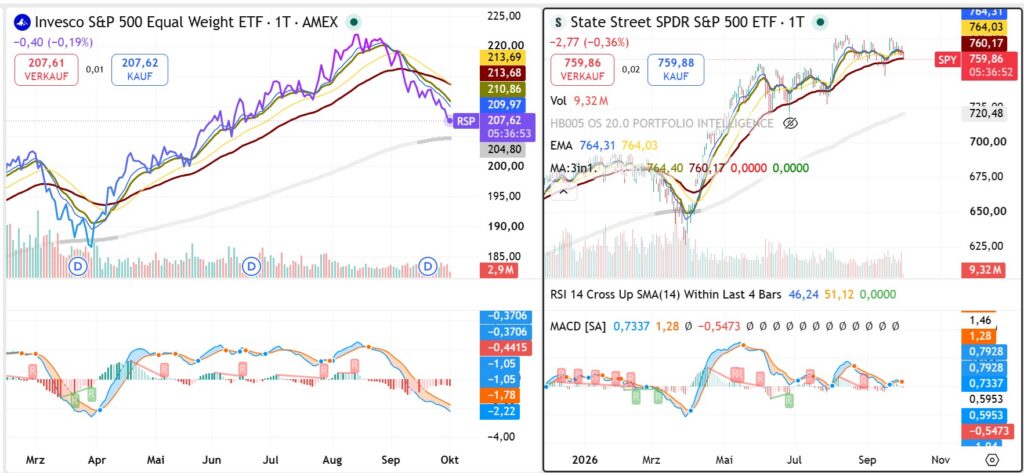
S&P 500 Equal Weight versus S&P 500 relative-performance chart showing the sharp September 2026 deterioration in U.S. market breadth ahead of the jobs report.

The Market Is Stronger Than Its Stocks: September’s Breadth Divergence Faces Its Jobs-Test

The S&P 500 remains close to record territory, but September left most stocks behind. The divergence is unusually severe — and tomorrow’s employment report may reveal whether this is temporary concentration or the beginning of a more consequential change in market regime. THE INDEX IS HIDING SOMETHING The most important fact about the U.S. equity

The Market Is Stronger Than Its Stocks: September’s Breadth Divergence Faces Its Jobs-Test Read More »

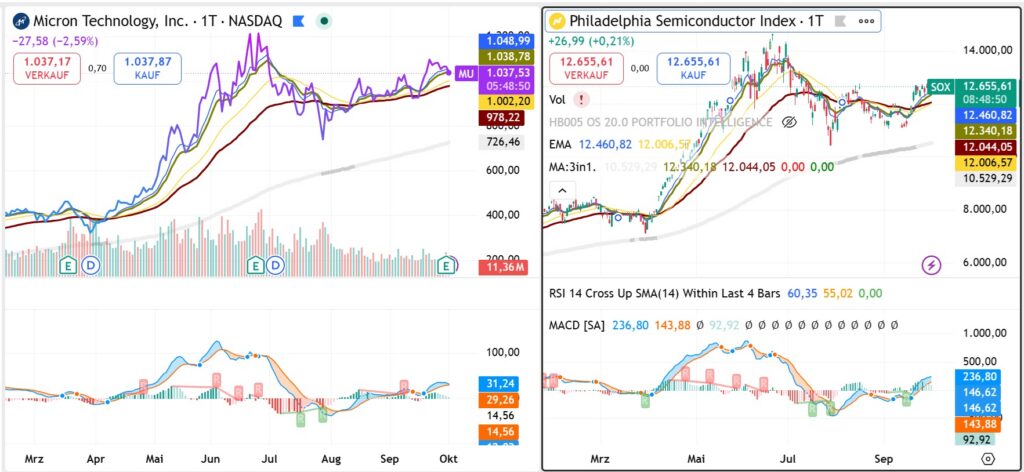
Micron relative performance versus the Philadelphia Semiconductor Index illustrating whether AI, HBM demand and tighter memory supply are changing the traditional semiconductor memory cycle.

Micron After the Blowout: Has AI Finally Broken the Memory Cycle?

Micron has just delivered numbers that would once have looked impossible for a memory manufacturer. The investment question is no longer whether AI is driving demand. It is whether HBM, contracted supply and capital discipline have permanently changed the economics of memory — or merely created the strongest cycle yet. THE MOST IMPORTANT MICRON NUMBER

Micron After the Blowout: Has AI Finally Broken the Memory Cycle? Read More »

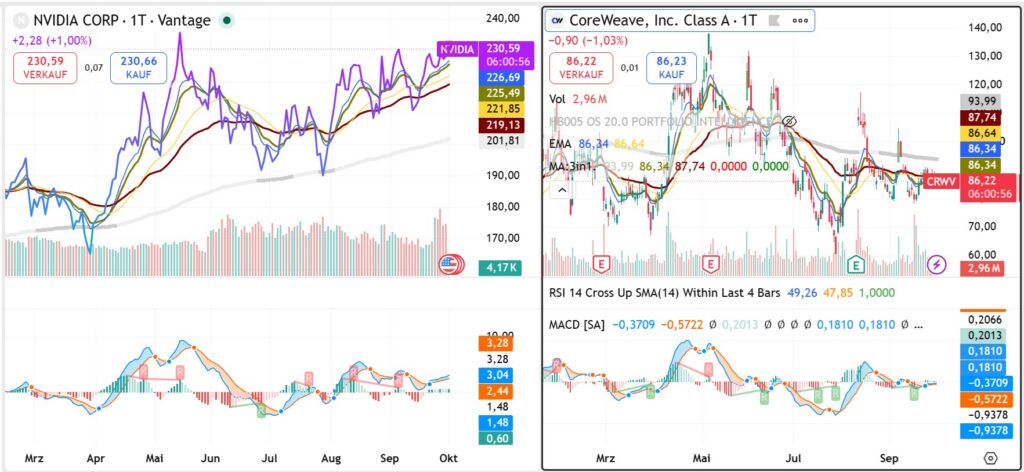
Nvidia and CoreWeave stock performance comparison illustrating the circular financing debate surrounding AI infrastructure and GPU demand.

The AI Money Loop: Why Nvidia’s Next Earnings Will Test More Than Chip Demand

Circular financing does not prove that the AI boom is artificial. But as Nvidia becomes supplier, investor, infrastructure facilitator and ecosystem financier at the same time, investors need a new test: is AI demand becoming economically self-sustaining outside the capital loop? THE REAL RISK IS NOT THAT THE REVENUE IS FAKE The most important number

The AI Money Loop: Why Nvidia’s Next Earnings Will Test More Than Chip Demand Read More »

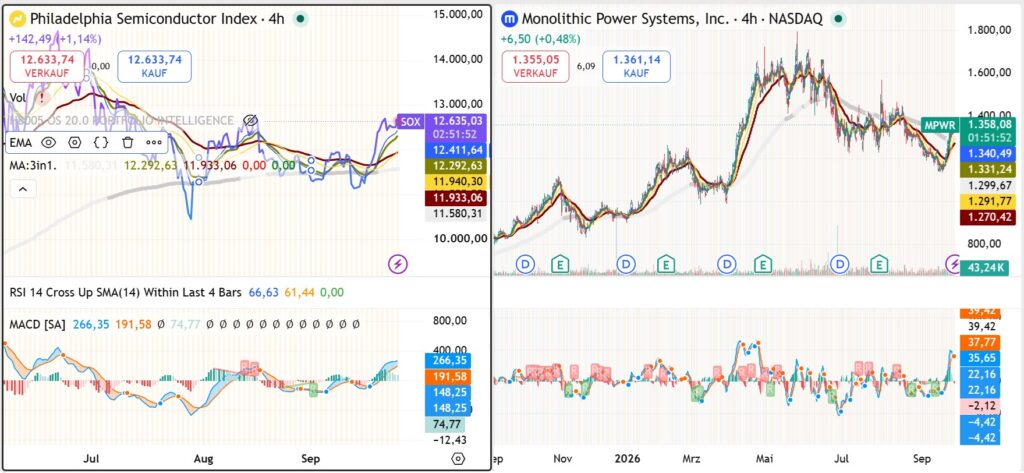
Monolithic Power Systems MPWR versus Philadelphia Semiconductor Index showing relative strength as AI power infrastructure demand accelerates

Monolithic Power Systems Is Sending a Bigger Signal: The AI Trade Is Moving From Compute to Power

Monolithic Power Systems has surged roughly 15% in five trading days even as Treasury yields again moved above 5%. That divergence contains an important market message: investors are increasingly distinguishing between speculative AI duration and companies positioned at physical bottlenecks of the AI buildout. The Stock That Should Be Struggling — But Isn’t A semiconductor

Monolithic Power Systems Is Sending a Bigger Signal: The AI Trade Is Moving From Compute to Power Read More »

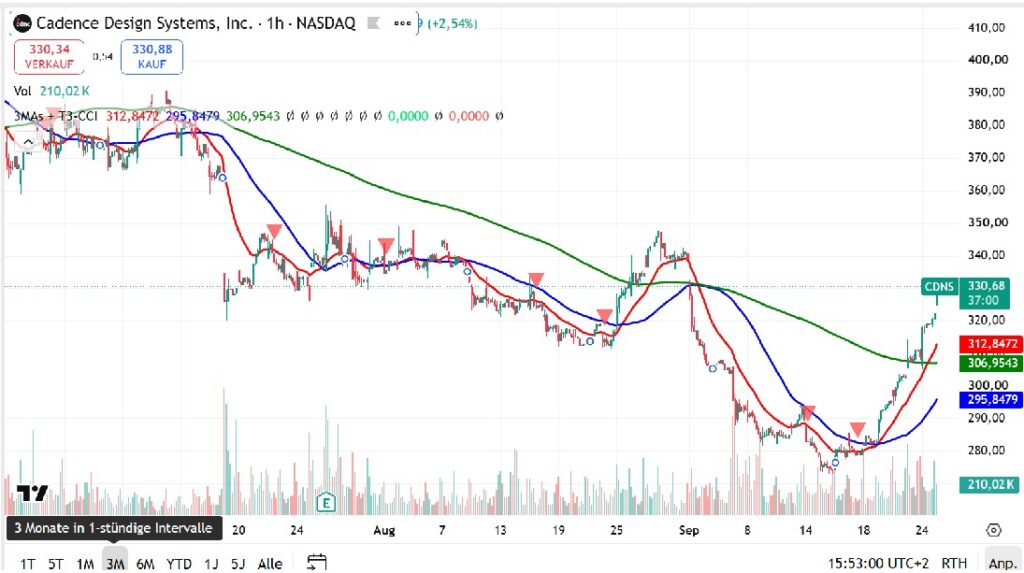
Cadence Design Systems CDNS stock chart showing the September 2026 rally following the launch of its ChipStack AI RTL Generation Agent

Cadence Design Systems: Why CDNS Just Jumped 17% — And the Hidden Variable That Determines What Comes Next

Cadence Design Systems has gained roughly 17% in five trading days. The obvious explanation is AI enthusiasm. The more important question is whether agentic chip design can change Cadence’s economic role in semiconductor development — enough to justify another valuation regime. The Market May Be Repricing Something Bigger Than an AI Product Launch Cadence Design

Cadence Design Systems: Why CDNS Just Jumped 17% — And the Hidden Variable That Determines What Comes Next Read More »