 LWAYS OPEN
By FRL DEEP RESEARCH Final Resurrection Limited | Market Intelligence US equities have shifted from a broad technology-led…
By FRL DEEP RESEARCH Final Resurrection Limited | Market Intelligence
US equities have shifted from a broad technology-led advance into a more fragile market environment. Semiconductor weakness, rising Treasury yields and unusually restrained volatility suggest that the correction may be more significant than headline index movements imply. The coming week could determine whether this is a temporary reset or a deeper repricing.
The market is falling — but the VIX is not telling the whole story
The most revealing feature of the current US equity sell-off is not how far the Nasdaq has fallen. It is how little fear the volatility market appears to be pricing despite the deterioration beneath the surface.
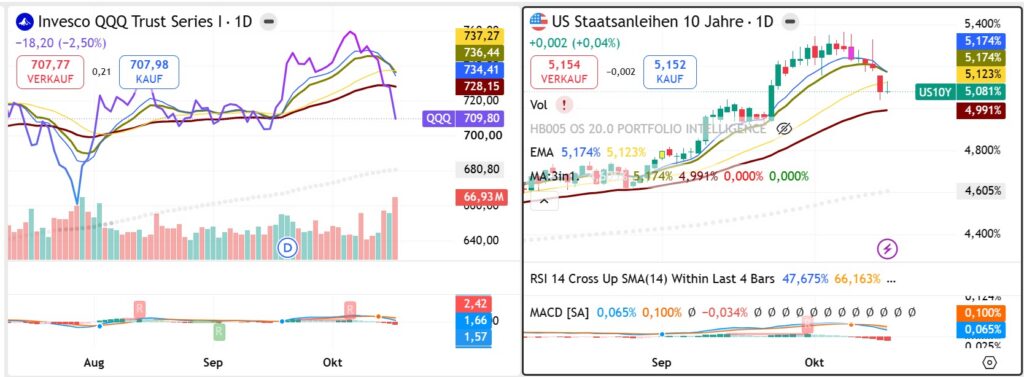
The Nasdaq-100 ETF QQQ has dropped sharply from its early-October highs, semiconductor shares have suffered an even more pronounced reversal, and NVIDIA has moved below several important short-term technical levels. Yet the VIX, at approximately 15.93 in the supplied chart, remains below the conventional 18–20 zone associated with a more defensive market environment.
That divergence deserves attention.
Ordinarily, a rapid retreat in technology leadership accompanied by pressure on growth valuations would be expected to generate a more substantial increase in demand for downside protection. Instead, the market appears to be experiencing considerable price deterioration without an equivalent surge in implied volatility.
This does not establish that investors are complacent. But it raises a more important question: Is the market merely correcting excessive optimism, or are investors still underestimating the possibility of a broader deterioration?
The answer may become clearer during the trading week of October 19–23.
1. How many weeks has the market been declining?
The answer depends on which market we examine and whether we measure the decline from the latest peak or from the beginning of a broader deterioration in momentum.
The supplied charts indicate that the most recent US equity downturn began around the first week of October.
As of October 18, this represents approximately two calendar weeks of correction, or roughly nine to ten trading sessions, rather than an uninterrupted multiweek bear market.
The distinction matters: the broad S&P 500 has weakened, but technology and semiconductor stocks have experienced a considerably more damaging move.
| Market indicator | Chart reference | What it reveals |
|---|---|---|
| S&P 500 ETF (SPY) | $763.27 | Weakening, but relatively resilient |
| Nasdaq-100 ETF (QQQ) | $709.86 | Sharp deterioration in growth leadership |
| Philadelphia Semiconductor Index (SOX) | 11,137.29 | Particularly severe technology-sector weakness |
| NVIDIA (NVDA) | $214.08 | Below important short-term trend levels |
| VIX | 15.93 | Limited volatility confirmation |
| US 10-year Treasury yield | 5.081% | Persistent valuation pressure |
| WTI crude oil | $100.96 | Additional inflation-related risk |
Reference values are taken from the supplied TradingView screenshots around October 18, 2026. They are chart observations, not independently verified official closing prices. The SPY, QQQ and SOX charts use four-hour intervals; NVIDIA and Treasury yields use daily charts. Some quote boxes display different bid/ask values.
A more useful description than “two weeks of falling markets” is therefore:
A two-week correction in US equities, accompanied by a disproportionately severe breakdown in semiconductor leadership.
This is not yet sufficient evidence to classify the entire market as being in a sustained bear-market regime.
2. What is driving the decline?
Three interacting pressures stand out.
High Treasury yields are challenging equity valuations
The US 10-year Treasury yield is shown around 5.08%, a level that makes long-duration equity valuations more sensitive to changes in growth and inflation expectations.
High-growth technology businesses derive a substantial part of their valuation from expected future earnings. Higher discount rates reduce the present value of those expected cash flows.
However, the supplied Treasury chart contains an important nuance: yields have eased from recent highs, while technology stocks have continued to fall.
That means the sell-off cannot be explained simply as a mechanical response to rising bond yields.
One possible interpretation is that the market has begun reassessing earnings expectations, positioning or the price previously paid for growth.
Semiconductor leadership has broken down
The SOX index has fallen from approximately 13,270 to 11,137 in the chart, a decline of roughly 16%.
Meanwhile, the QQQ has fallen from approximately 760 to 710, or around 7%.
These are approximate peak-to-reference comparisons, not synchronized official closing-return calculations.
Nevertheless, the magnitude of the difference is meaningful. Semiconductor companies had been among the strongest expressions of enthusiasm for AI infrastructure, advanced computing and technology capital expenditure.
Their reversal suggests that investors are no longer willing to reward the entire technology complex indiscriminately.
The issue may not be whether artificial intelligence remains a major investment theme. It may be whether current prices adequately reflect execution risks, spending requirements, profit margins and the timing of returns on enormous capital investments.
Oil is adding another potential constraint
The supplied WTI chart shows crude oil above $100 per barrel, following a substantial recovery from its early-October levels.
If sustained, higher energy prices could complicate the inflation outlook and reduce the scope for lower interest rates.
The causal chain matters:
Higher energy costs can increase inflation pressure, which can keep expected policy rates elevated, which can support Treasury yields and weigh on equity valuation multiples.
This is a risk transmission mechanism, not proof that oil caused the current sell-off.
3. THE DIVERGENCE THAT MATTERS: Bonds are stabilising, but technology is not
The strongest market intelligence signal is emerging from the relationship between Treasury yields and technology equities.
According to Nasdaq’s October 16 market analysis, the Nasdaq-100 lost approximately 5% during the week even as the US 10-year Treasury yield eased toward 5.1%. Nasdaq also identified three central developments: oil-supply disruptions, unexpectedly high inflation and renewed concerns about the AI investment cycle.
Nasdaq
+1
This combination challenges the simplest explanation of the sell-off.
If higher interest rates were the only problem, falling yields should have offered technology stocks meaningful relief. Yet the market continued to sell some of its most important growth businesses.
The market’s central divergence
NASDAQ-100, WEEK TO OCT 16
≈ −5%
Nasdaq weekly assessment
US 10-YEAR YIELD
≈ 5.1%
Easing from recent highs
The implication: Lower yields are no longer sufficient, by themselves, to restore confidence in the technology trade.
This suggests that the market may be transitioning from a predominantly interest-rate-driven valuation debate toward a broader assessment of earnings quality, capital expenditure and financial risk.
The second-order problem: The cost of the AI investment boom
Artificial intelligence remains a powerful structural growth opportunity. But the economics of financing AI infrastructure are receiving closer scrutiny.
Large investments in data centres, specialised computing equipment and power infrastructure require substantial upfront expenditure. For companies relying on external financing, high borrowing costs can increase the time needed to generate attractive returns.
The market is therefore asking a different question.
Not simply: How quickly can AI revenues grow?
But: How much capital must be committed before those revenues generate sustainable free cash flow?
Reuters reported on October 16 that concerns about the debt supporting AI infrastructure contributed to technology-sector selling. CoreWeave was among the companies experiencing particularly significant pressure.
Reuters
+1
That matters because investors may begin distinguishing much more aggressively between companies with strong balance sheets and internally funded investment programmes, and businesses dependent on continuous access to financing.
This would represent a change in market leadership, not necessarily the end of the AI growth story.
4. Sector rotation: A correction beneath the index
The broad US market is not displaying uniform weakness.
During the week ending October 16, technology and communication services underperformed, while utilities and energy proved relatively resilient. Reuters also reported that the Dow Jones Industrial Average managed a modest weekly gain while the S&P 500 and Nasdaq declined.
Reuters
This distinction is important.
If every sector were falling simultaneously, the evidence would point more clearly toward indiscriminate risk liquidation.
Instead, the current pattern is consistent with selective risk reduction and sector rotation.
Investors appear increasingly sensitive to capital intensity, financing requirements and the reliability of future cash flows.
However, sector performance alone does not establish whether market breadth is improving. That requires separate evidence from advance-decline statistics, the percentage of stocks above moving averages and equal-weighted index performance.
Interpretation: The market is repricing the quality and financing requirements of growth rather than uniformly rejecting equities.
Potential implication: A recovery led only by a handful of mega-cap stocks could leave the wider market vulnerable. A recovery supported by improving semiconductor participation and broader market breadth would provide stronger confirmation.
5. Why the next week could be decisive
The week of October 19–23 begins with several technical conditions already weakened.
QQQ is below the three moving averages displayed on the supplied four-hour chart. The SOX has fallen below its corresponding moving averages, and NVIDIA is trading below the short-term levels that previously supported its advance.
The next important test is whether these markets can reclaim broken support levels or whether rebounds are sold.
The upcoming economic calendar adds another dimension. The US Bureau of Labor Statistics schedules state employment data for October 20 and weekly earnings data for October 21. Additional releases later in the week include jobless claims and preliminary business-activity indicators.
Bureau of Labor Statistics
+1
Because the Federal Reserve is entering its pre-meeting communications blackout period, fresh economic evidence and corporate results may have an especially important role in shaping expectations.
Three possible scenarios for October 19–23
Recovery
Scenario A — A technical recovery develops
QQQ recovers above approximately $720 and subsequently challenges $735. Semiconductor selling moderates, while Treasury yields remain stable or decline.
This would suggest that part of the correction reflected positioning and short-term liquidation rather than a sustained deterioration in expectations.
Consolidation
Scenario B — A volatile stabilisation phase
QQQ oscillates around $700–720, yields remain elevated and the SOX fails to reclaim its previous support area.
Investors may be waiting for earnings evidence before committing to a new directional trend. Sharp rallies and renewed selling could coexist.
Further decline
Scenario C — The correction broadens
QQQ breaks below $700 and moves toward the approximately $689 reference area, while semiconductor weakness persists and SPY loses its next important support zone.
A simultaneous increase in volatility and deterioration in market breadth would suggest that the correction is spreading beyond technology.
These are conditional scenarios, not probability-weighted forecasts. The levels are analytical reference zones drawn from the supplied charts, not guaranteed support or resistance.
6. WHAT TO WATCH NEXT
Five indicators deserve priority during the coming week.
| Indicator | Confirmation of stabilisation | Warning of further weakness |
|---|---|---|
| QQQ | Reclaims $720, then $735 | Sustained break below $700 |
| SOX | Recovers toward 12,050–12,300 | Continued weakness around or below 11,100 |
| US 10-year yield | Stabilises near or below 5.1% alongside improving equities | Renewed yield surge, or falling yields alongside worsening equity breadth |
| VIX | Remains subdued while equity participation improves | Moves above 18–20 alongside new equity lows |
| SPY and market breadth | SPY reclaims $771–774 with broader participation | Break below approximately $756 accompanied by declining breadth |
All price thresholds are monitoring levels derived from the supplied charts, not verified real-time quotes. VIX data should be checked against the latest official Cboe reading before publication or use.
One distinction deserves particular attention: falling Treasury yields are not automatically bullish for equities.
If yields fall because inflation expectations improve, growth stocks may benefit.
If yields fall because investors fear weakening economic activity or credit deterioration, equities may continue to decline.
The direction of yields is therefore less informative than the reason yields are moving and how equities respond.
The same principle applies to the VIX. Its relatively restrained level in the supplied chart should not be treated as definitive evidence of investor complacency. Volatility expectations, realised market volatility and the structure of options demand can diverge. Moreover, other reporting from the October 16 session described VIX readings above 20, making a fresh Cboe verification essential.
Barron’s
7. Conclusion: A change in what the market rewards
The US equity market has experienced approximately two weeks of increasingly concentrated weakness, with semiconductor and AI-related businesses bearing a disproportionate share of the pressure.
But the most important development is not simply the decline itself.
It is the market’s apparent unwillingness to reward technology stocks even when Treasury yields retreat.
This suggests that investors may be moving beyond a narrow debate about interest rates and toward a more demanding examination of capital expenditure, financing costs and the sustainability of future profits.
A short-term rebound remains entirely possible after such a sharp decline. Yet a durable recovery would require more than a temporary improvement in the Nasdaq.
It would require evidence that semiconductor leadership is stabilising, participation is broadening and the relationship between interest rates and equity valuations is becoming constructive again.
The coming week will not necessarily decide the long-term direction of the market. But it may reveal whether investors are still buying temporary weakness — or beginning to question the assumptions that supported the previous advance.
WIEDER WAS GELERNT
One of the most useful lessons in market analysis is that the relationship between asset classes often reveals more than the direction of any single market.
When technology shares decline while Treasury yields rise, the explanation appears straightforward: higher discount rates are putting pressure on valuations. But when yields subsequently decline and technology stocks continue falling, that original explanation becomes incomplete.
This is where serious market interpretation begins.
The question is no longer merely what happened to interest rates. It becomes why equities are failing to respond to an apparently favourable development.
Perhaps earnings expectations are deteriorating. Perhaps investors are reducing crowded positions. Perhaps the financing requirements of an investment theme are being reassessed.
The correct interpretation must be tested against subsequent price action, sector participation and corporate evidence.
Headline-focused investors can miss this transition because they examine events individually rather than studying the relationships between them.
The market’s most important message is often found in the reaction that should have happened — but did not.
MARKET INTELLIGENCE — WHAT IS REALLY DRIVING THIS MARKET?
The short answer: Headlines are triggering market moves, but fundamentals, positioning and changing expectations are determining their direction and persistence. Charts reveal how those forces are being priced.
The October sell-off provides an important example.
- HEADLINES: Inflation concerns, elevated oil prices, AI financing risks and interest-rate uncertainty are providing catalysts for selling.
- FACTS: Treasury yields remain high, AI infrastructure requires enormous capital expenditure, and investors are increasingly questioning whether future earnings will justify current valuations.
- CHARTS: QQQ and semiconductor stocks have broken important technical levels. More revealingly, technology shares have continued declining even as Treasury yields have eased.
That last observation is particularly significant.
If rising yields were the sole explanation for falling technology stocks, declining yields should produce a more convincing recovery. The failure to do so suggests that something deeper may be changing in investor expectations.
What is driving the market right now?
1. Changing expectations and positioning
Primary driver
Investors are reassessing growth, valuations, financing risks and how much optimism is already reflected in prices.
2. Headlines and economic releases
These provide catalysts, accelerate repositioning and can change expectations abruptly.
3. Technical levels and market structure
Broken support levels, systematic trading, hedging and liquidity conditions can amplify moves already underway.
This is a qualitative ranking, not a statistically measured attribution of market movements.
The most important conclusion for investors
We are not necessarily witnessing a market that has stopped believing in AI, economic growth or corporate profitability.
We may instead be witnessing a market that is becoming less willing to pay yesterday’s prices for tomorrow’s promises.
That is a fundamentally different problem from a temporary negative headline.
For the week of October 19–23, the critical test is whether QQQ, SOX and NVIDIA can stabilise even if negative headlines continue. If they do, selling pressure may be exhausting itself. If favourable news and easing yields fail to generate sustained recoveries, the repricing may still be underway.
FRL DEEP RESEARCH — THE BOTTOM LINE
Headlines explain why traders react today. Fundamentals and expectations help explain whether the reaction can last. Charts show whether the market agrees.
The decisive signal is not the news itself. It is what prices do when the news should have moved them in the opposite direction.
Disclaimer: This publication provides general financial-market research and market intelligence for informational purposes only. It does not constitute investment advice, personalised financial guidance or a recommendation to buy or sell any financial instrument. Market scenarios and technical reference levels are uncertain and may change without notice.
By FRL DEEP RESEARCH Final Resurrection Limited | Market Intelligence US equities have shifted from a broad technology-led…