
FINAL RESURRECTION LTD & TITAN OPTIONS CIRCLE

Here we describe specific strategic investment ideas developed by and for Registered Members of the TITAN Options Circle. Interested parties reaching this page who are NOT AN ACTIVE MEMBER have no permission to read this information and have to excit this page instantly.

Investment Strategies

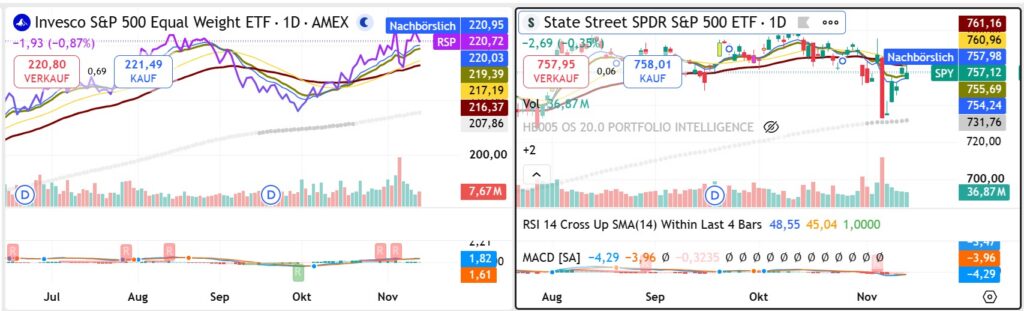
TradingView RSP/SPY relative strength chart comparing equal-weight and market-cap-weighted S&P 500 performance during November 2026, illustrating market breadth and sector rotation risk.

Rising Yields and Sector Rotation: The Risk-Migration Test

Nvidia, Rising Yields and Sector Rotation: The Risk-Migration Test Why the next phase of the market may reward confirmation over conviction FRL DEEP RESEARCHFinal Resurrection Limited | TITAN Options CircleMarket Strategy Research | November 12, 2026 The departure of Nvidia’s founder has exposed a deeper market question: is capital broadening into a healthier bull market,

Rising Yields and Sector Rotation: The Risk-Migration Test Read More »
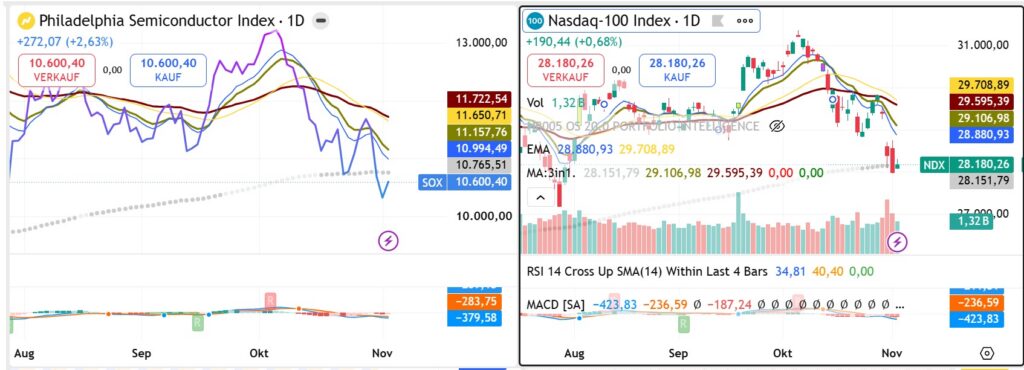
Semiconductor Index versus Nasdaq-100 relative strength chart examining market leadership and sector rotation after the 2026 U.S. midterm elections.

AFTER THE 2026 MIDTERMS: WHY A MARKET RECOVERY MAY NOT MEAN THE AI SELL-OFF IS OVER

The Hidden Divide Between Political Relief, Semiconductor Weakness and the Next Market Opportunity FRL DEEP RESEARCH November 4, 2026 | U.S. Equity Markets | Post-Election Strategy | Outlook Through Year-End THE INVESTMENT QUESTION The Democrats’ midterm sweep has lowered one kind of market risk while intensifying another. Falling Treasury yields may support broader equities, but

AFTER THE 2026 MIDTERMS: WHY A MARKET RECOVERY MAY NOT MEAN THE AI SELL-OFF IS OVER Read More »

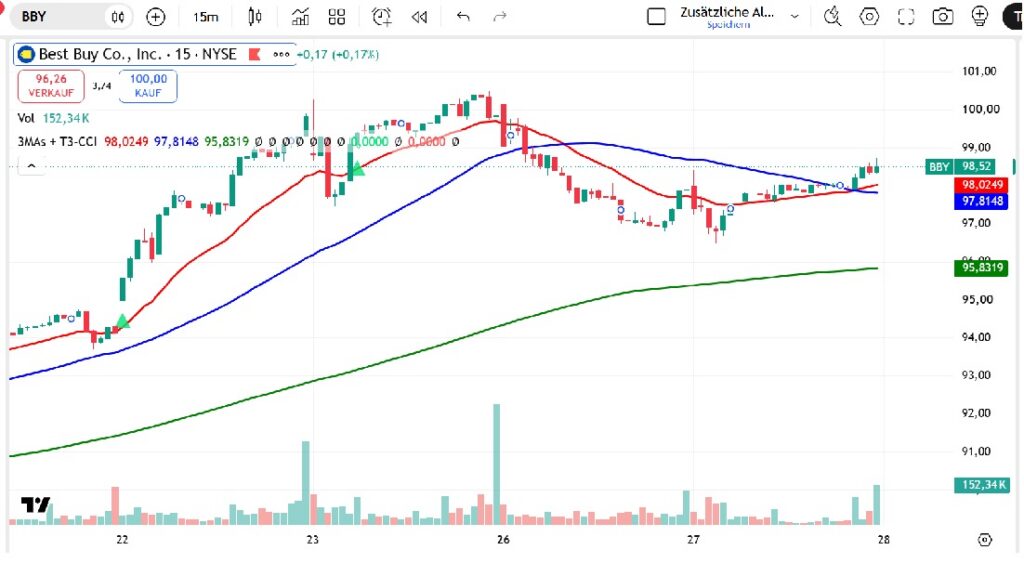
Best Buy (NYSE:BBY) 15-minute stock chart illustrating a conditional buy-limit entry near a previous trading low ahead of the October 2026 Federal Reserve decision.

Fed and Earnings Trading Strategy: The Hidden Risk in Conditional Orders

FRL DEEP RESEARCH | Final Resurrection Limited & TITAN Options Circle 28 October 2026 | Research & Strategy Discussions DECK The Federal Reserve decision and a concentrated earnings calendar present opportunities for disciplined event-driven trading. But the decisive advantage may not come from predicting market direction. It may come from understanding which orders execute, when

Fed and Earnings Trading Strategy: The Hidden Risk in Conditional Orders Read More »

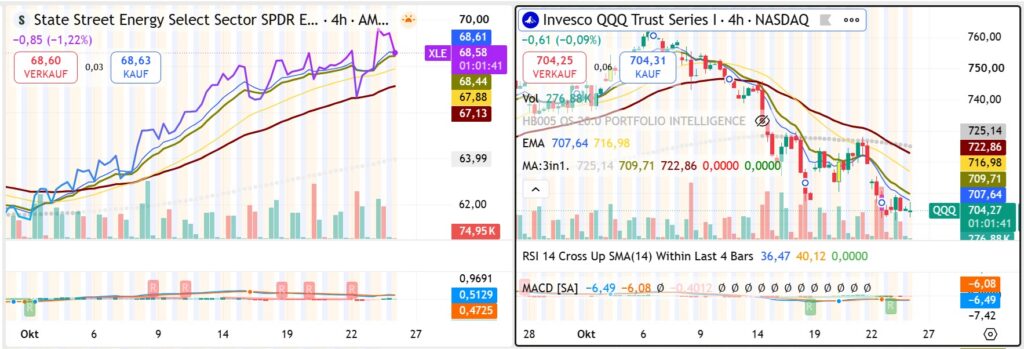
TradingView relative strength chart comparing US energy stocks (XLE) with the Nasdaq-100 (QQQ), highlighting October 2026 sector rotation and inflation-related market risks.

The Market’s Strongest Sector May Also Be Its Biggest Warning

The TITAN Weekly Market Strategy: Sector Rotation, AI Earnings, Inflation Risk and the Discipline of Waiting for Confirmation FRL DEEP RESEARCH | October 26, 2026 Category: FINAL RESURRECTION LTD & TITAN OPTIONS CIRCLE — Research & Strategy Discussions THE INVESTMENT THESIS Energy stocks are outperforming, technology leadership is deteriorating, and investors face an unusually concentrated

The Market’s Strongest Sector May Also Be Its Biggest Warning Read More »

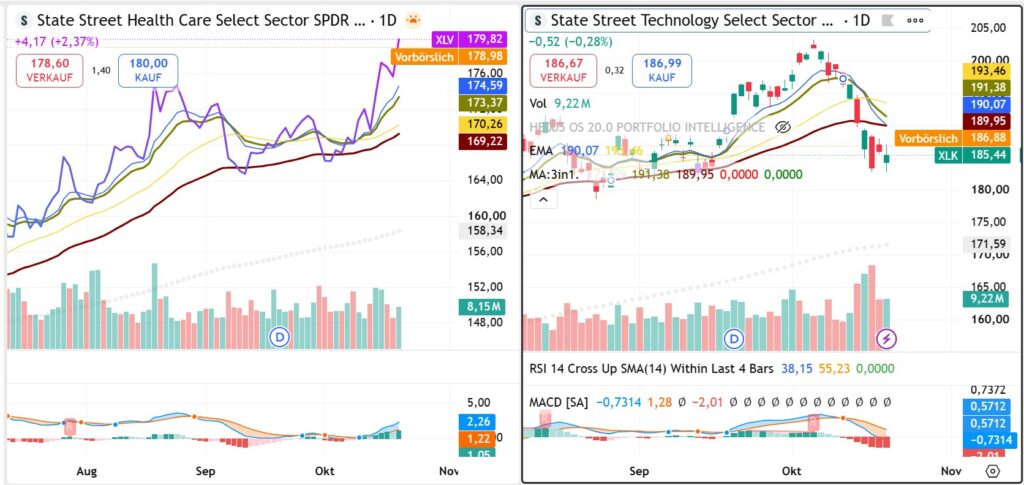
Healthcare-to-technology relative strength chart illustrating sector rotation and changing market leadership in October 2026.

Sector Rotation: How the New TITAN Market Traffic Light Detects Where Market Leadership Is Moving

The next opportunity may not be where the market is falling — but where leadership is quietly changing. FRL introduces a Sector Rotation Traffic Light that combines relative strength, absolute performance, market conditions and risk assessment to distinguish genuine opportunities from misleading signs of outperformance. The Market Can Change Leadership Without Changing Direction The most

Sector Rotation: How the New TITAN Market Traffic Light Detects Where Market Leadership Is Moving Read More »

FRL Market Signals Library – Behind the Signals Development Journal #001. Financial market research featuring Wall Street forecasts, institutional research, stock market charts and historical market analysis from 2024 to 2026.

BEHIND THE SIGNALS — Development Journal

What If We Could Look Back at Wall Street’s Predictions — and See What Actually Happened? 14 October 2026 | Final Resurrection Limited Every day, major financial institutions publish market outlooks, investment opinions and economic forecasts. Goldman Sachs, Bloomberg, Reuters, Interactive Brokers and many others provide investors with a continuous stream of information. But there

BEHIND THE SIGNALS — Development Journal Read More »

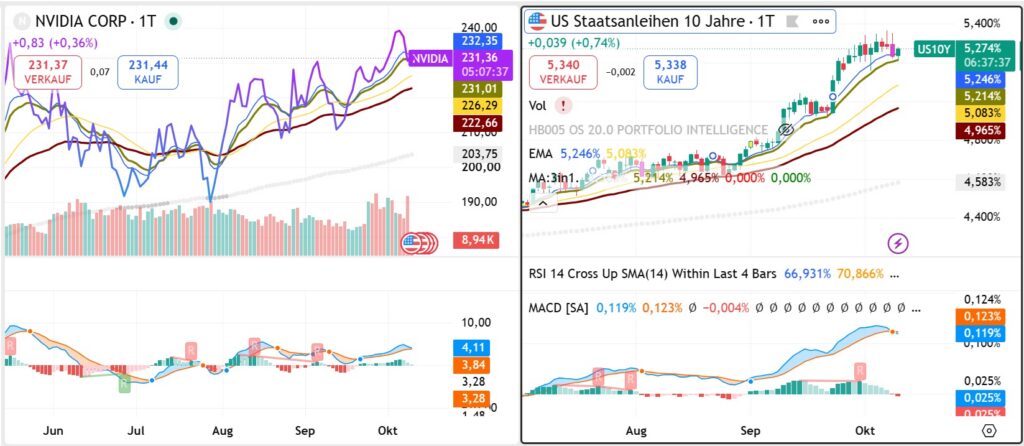
Nvidia stock price and US 10-year Treasury yield comparison illustrating financing risks facing the artificial intelligence infrastructure boom in October 2026.

The AI Boom’s $1.5 Trillion Financing Test: Why Nvidia’s Weakness May Be Warning of a Bigger Market Shift

Research & Strategy Discussions | 9 October 2026 | FRL DEEP RESEARCH The greatest risk to the artificial intelligence investment cycle may no longer be insufficient demand, but the widening gap between infrastructure investment, financing costs and cash generation. Nvidia’s weakness, resilient broad-market indices and elevated Treasury yields suggest that investors may be starting to

The AI Boom’s $1.5 Trillion Financing Test: Why Nvidia’s Weakness May Be Warning of a Bigger Market Shift Read More »

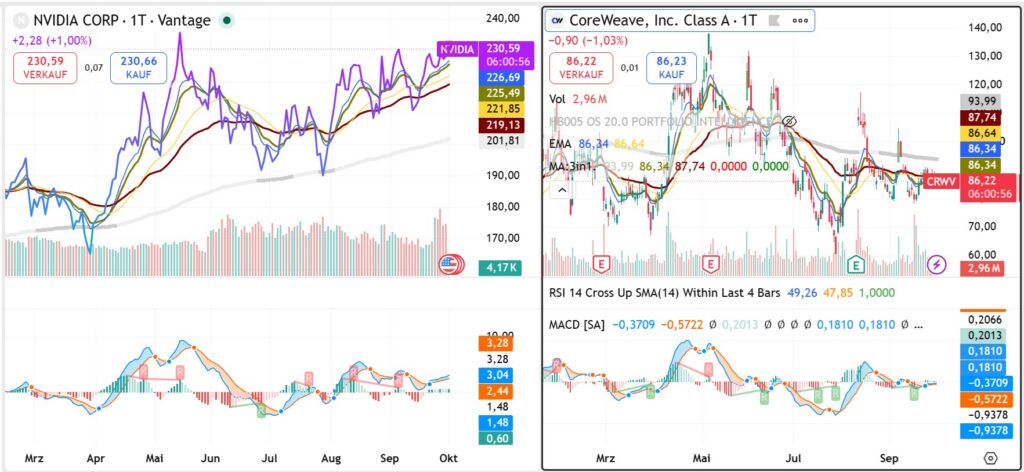
Nvidia and CoreWeave stock performance comparison illustrating the circular financing debate surrounding AI infrastructure and GPU demand.

The AI Money Loop: Why Nvidia’s Next Earnings Will Test More Than Chip Demand

Circular financing does not prove that the AI boom is artificial. But as Nvidia becomes supplier, investor, infrastructure facilitator and ecosystem financier at the same time, investors need a new test: is AI demand becoming economically self-sustaining outside the capital loop? THE REAL RISK IS NOT THAT THE REVENUE IS FAKE The most important number

The AI Money Loop: Why Nvidia’s Next Earnings Will Test More Than Chip Demand Read More »

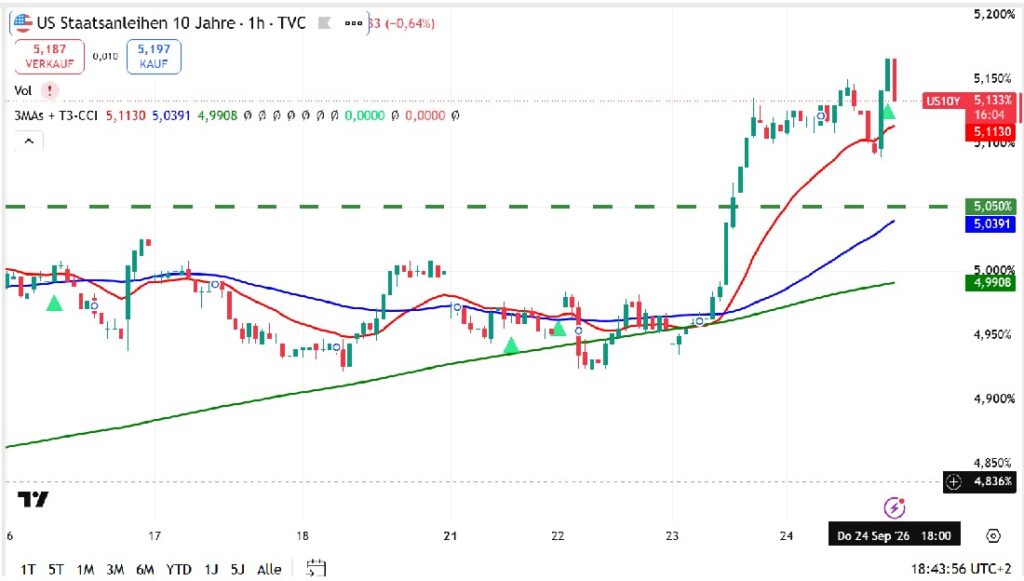
U.S. 10-Year Treasury yield above 5 percent as rising interest rates pressure AI and technology stock valuations

The 5% Yield Test: Why the Next AI Buying Opportunity Starts in the Bond Market

The temptation after a technology sell-off is to ask which stock has fallen far enough to buy. That may be the wrong question. With the U.S. 10-year Treasury yield above 5%, the more important signal is whether the discount-rate shock is stabilising — because that may determine whether today’s weakness becomes an opportunity or merely

The 5% Yield Test: Why the Next AI Buying Opportunity Starts in the Bond Market Read More »

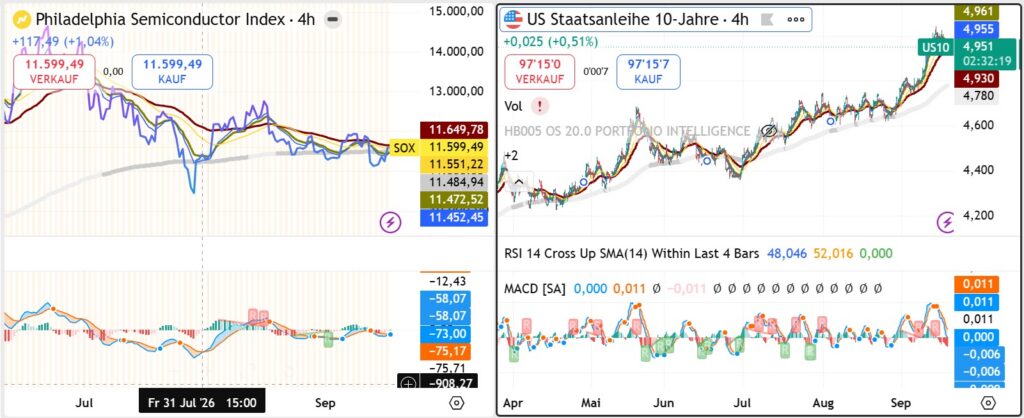
Philadelphia Semiconductor Index versus US 10-Year Treasury yield after the September 2026 Federal Reserve rate hike

After the Fed Hike, Don’t Buy “Rate-Hike Winners” — Buy the Businesses That Can Outgrow the Discount Rate

Deck: THE REAL POST-FED QUESTION: WHO CAN FINANCE THE GROWTH? The first Federal Reserve rate increase in more than three years changes the investment question. The obvious interpretation is that higher rates are bad for growth stocks because they increase the discount rate applied to future earnings. That remains true. High-growth companies do not become

After the Fed Hike, Don’t Buy “Rate-Hike Winners” — Buy the Businesses That Can Outgrow the Discount Rate Read More »