 LWAYS OPEN

The TITAN Weekly Market Strategy: Sector Rotation, AI Earnings, Inflation Risk and the Discipline of Waiting for Confirmation
FRL DEEP RESEARCH | October 26, 2026
Category: FINAL RESURRECTION LTD & TITAN OPTIONS CIRCLE — Research & Strategy Discussions
THE INVESTMENT THESIS
Energy stocks are outperforming, technology leadership is deteriorating, and investors face an unusually concentrated week of monetary-policy decisions and corporate earnings. Our strategy is not to chase the strongest sector blindly, but to distinguish profitable rotation from broader market stress — and act only when the evidence supports the risk.
The Market’s Strongest Sector May Also Be Its Biggest Warning
The most important development in the US stock market is not simply that technology shares have fallen while energy stocks have advanced. It is that the economic forces supporting energy may be precisely those threatening the broader equity market.
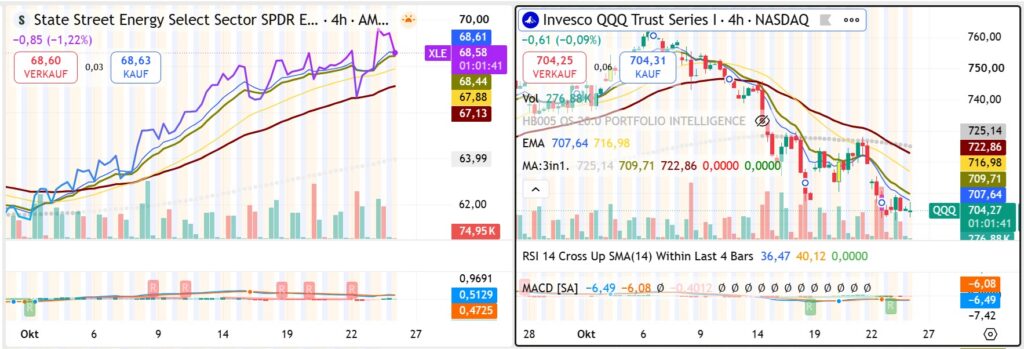
On Friday, October 23, the Energy Select Sector SPDR ETF (XLE) advanced 2.60%, while the S&P 500 declined 0.52%. Only three of the eleven S&P 500 sectors finished higher.
At first glance, that appears to support a straightforward investment strategy: rotate out of technology and into energy.
But that interpretation misses a potentially decisive distinction.
Energy leadership driven by stronger economic demand is fundamentally different from energy leadership driven by supply disruptions, geopolitical tension and inflation expectations.
The first can accompany a healthy market expansion. The second can undermine corporate margins, consumer purchasing power and the valuation of long-duration growth assets.
This distinction matters particularly now.
The Federal Reserve announces its next policy decision on Wednesday, October 28. Microsoft and Alphabet report earnings that evening, followed by US GDP and inflation data on Thursday and Amazon’s quarterly results.
Investors are therefore confronting two connected questions: Can the AI investment cycle justify its rising capital requirements, and can the broader economy withstand renewed inflationary pressure?
Our approach begins by treating those questions as one interconnected market problem rather than two separate stories.
1. THE FACTS: A MARKET WITH INCREASINGLY UNEVEN LEADERSHIP
The closing figures from Friday, October 23, provide the starting point for the week.
| Market indicator | Latest verified reading | Strategic significance |
|---|---|---|
| S&P 500 | 7,623.68 | Broad-market weakness |
| Nasdaq-100 ETF (QQQ) | $704.40 | Growth leadership under pressure |
| Philadelphia Semiconductor Index (SOX) | 10,779.46 | Semiconductor recovery remains unconfirmed |
| Energy ETF (XLE) | $69.33 | Strong relative leadership |
| VIX | 19.45 | Elevated caution |
| US 10-year Treasury yield | Approximately 5.0% | Pressure on equity valuations |
| WTI crude oil | Approximately $103–104/barrel | Renewed inflationary risk |
Observations refer to the October 23 close. Market levels are not live quotations for October 26.
The sector breakdown adds an important dimension.
Energy gained 2.60%, technology rose 0.49%, and real estate advanced 0.12%. The remaining eight sectors declined, including financials, industrials, consumer discretionary and consumer staples.
Technology’s modest Friday gain followed a severe sell-off on Thursday. That stabilisation should not yet be confused with a confirmed recovery.
FACT: Energy outperformed while overall market breadth remained weak.
SIGNAL: Investors are rewarding selective exposures rather than participating in a broad-based equity advance.
IMPLICATION: Relative sector strength can offer opportunities, but it does not automatically reduce total market risk.
ACTION FRAMEWORK: Evaluate both the direction of the leading sector and the condition of the surrounding market before interpreting sector leadership as a durable investment opportunity.
2. OUR MARKET STRATEGY: CAUTIOUS, SELECTIVE AND CONDITIONAL
For October 26–30, our working assessment is:
Overall market: ORANGE–RED. Technology and semiconductors: RED. Energy: relatively constructive, but event-sensitive.
These classifications are FRL research interpretations, not independently published market indicators or guaranteed forecasts.
The strategy is organised around three decisions.
Decision One: Avoid treating every technology decline as an opportunity
The Nasdaq-100 and semiconductor stocks remain central to the market’s earnings and growth expectations.
However, rapid declines in leading growth stocks can produce impressive short-term rebounds without changing the underlying trend.
Our reference levels are:
- QQQ: $704.40 at the October 23 close, with approximately $720 as an initial recovery checkpoint.
- SOX: 10,779.46, with 11,100 as an initial recovery checkpoint and 11,450 as a more demanding confirmation level.
- VIX: 19.45, requiring attention to whether volatility stabilises or moves sustainably above 20.
These are analytical monitoring thresholds rather than universal support and resistance levels.
A recovery in QQQ without corresponding improvement in semiconductors, market breadth or volatility would remain suspect.
For that reason, we do not regard an isolated rebound in NVIDIA, Broadcom or other AI-related equities as sufficient evidence to restore an aggressive technology exposure.
Decision Two: Examine energy without chasing it
The energy sector offers the clearest observable relative strength entering the week.
XLE closed at $69.33 after reaching an intraday high of $69.72 on Friday.
Nevertheless, buying after an unusually strong session can create an unfavourable entry precisely when geopolitical news and crude-oil volatility are most influential.
Our preferred analytical framework is conditional:
| Condition | Interpretation | Research response |
|---|---|---|
| XLE consolidates around $68.45–68.80 | Potential pullback toward support | Examine whether relative strength persists |
| XLE sustains movement above $69.72 | Possible continuation of Friday’s advance | Seek price, volume and relative-strength confirmation |
| XLE falls below approximately $67.75 | The short-term bullish setup weakens | Reassess rather than automatically averaging down |
| Crude oil falls sharply and energy underperforms | The sector’s immediate catalyst may be fading | Withdraw the bullish short-term assumption |
The previously examined $70.20 and $71.20 areas remain illustrative upside reference points, not predicted outcomes.
For European investors, the State Street SPDR S&P U.S. Energy Select Sector UCITS ETF, traded on Deutsche Börse under ZPDE, provides a European-listed way to examine similar US energy-sector exposure.
Its euro price cannot be equated directly with XLE’s dollar price. Currency movements, fund structure and execution conditions need separate consideration.
Decision Three: Preserve flexibility ahead of concentrated catalysts
This is not a week in which investors necessarily benefit from maximising market exposure early.
The sequencing of events creates meaningful gap risk.
A market position that appears attractive on Tuesday can be repriced rapidly after Wednesday’s Federal Reserve communication, the same evening’s technology earnings, or Thursday’s inflation release.
Maintaining liquidity preserves the ability to reassess after new evidence emerges.
For short holding periods, the distinction between a sound thesis and a sound entry becomes especially important.
3. THE TITAN EDGE: WHEN SECTOR ROTATION BECOMES AN INFLATION SIGNAL
The central analytical insight of this week’s research is that a winning sector can simultaneously reveal a worsening macroeconomic environment.
Consider the chain of consequences.
First-order effect: Crude-oil prices rise, improving near-term revenue expectations for certain oil producers and supporting energy-sector equities.
Second-order effect: Higher fuel, transport, production and distribution costs create pressure elsewhere in the economy.
Third-order effect: Persistent energy inflation can complicate the Federal Reserve’s ability to ease monetary conditions, or reinforce expectations of restrictive interest rates.
Fourth-order effect: Higher discount rates and weaker expected margins can damage the valuation of growth companies, particularly those whose investment cases depend on earnings projected far into the future.
This creates a counterintuitive relationship.
The same force that supports energy-sector earnings may weaken the environment needed for a sustainable technology recovery.
Why this matters for AI-related companies
The current AI investment cycle involves extraordinary infrastructure expenditure.
Investors are increasingly required to distinguish among:
- Companies receiving immediate revenue from infrastructure spending.
- Companies financing major AI-capacity expansion.
- Companies expected to produce attractive long-term returns from that expenditure.
These categories overlap, but their economics are not identical.
Strong cloud revenue growth can coexist with heavy capital expenditure, reduced free cash flow or rising uncertainty over returns on invested capital.
The earnings from Microsoft, Alphabet and Amazon therefore matter beyond whether reported revenue and earnings exceed consensus expectations.
The more consequential questions concern incremental capital intensity, profitability and monetisation.
If management teams maintain or increase their AI investment plans while near-term cash generation disappoints, market participants may begin valuing otherwise successful businesses differently.
That could increase pressure on semiconductor suppliers even if underlying demand remains substantial.
Conversely, evidence that monetisation is advancing faster than capital requirements could materially improve the investment case.
The key distinction: relative strength versus absolute safety
A rising XLE/QQQ ratio indicates energy is outperforming the Nasdaq-100. It does not by itself show that energy prices are rising in absolute terms, that money is flowing directly from technology into energy, or that the broader market is becoming safer.
An investor who mistakes relative outperformance for protection can still experience losses during a general market decline.
This is why our Sector Rotation AMPEL should not rely on a single ranking of sector returns.
It must combine relative performance with absolute trends, market breadth, volatility, yields and the economic reason behind the leadership.
That is where sector analysis begins to become genuinely useful for investment decisions.
4. THE WEEK’S CATALYSTS: WHY THE ORDER MATTERS
| Date | Scheduled development | The strategic question |
|---|---|---|
| Tuesday, October 27 | Durable goods, consumer confidence and other economic data | Is underlying demand resilient? |
| Wednesday, October 28 | Federal Reserve decision; Microsoft and Alphabet earnings | Are interest-rate expectations and AI earnings mutually supportive? |
| Thursday, October 29 | US GDP, September PCE inflation; Amazon earnings | Does growth remain strong without further inflation pressure? |
| Friday, October 30 | Employment Cost Index; ExxonMobil and Chevron earnings | Are inflation and energy-sector profitability reinforcing each other? |
The Federal Reserve’s October 27–28 meeting is confirmed by its official calendar. The GDP and personal income/outlays releases are scheduled for October 29 by the US Bureau of Economic Analysis.
The macroeconomic releases can change how investors interpret the earnings announcements.
For example, strong technology results following a more restrictive monetary-policy message may not produce the same market response as identical earnings accompanied by falling Treasury yields.
Likewise, softer inflation can support growth-stock valuations but potentially reduce part of the momentum behind an energy trade if oil prices are also retreating.
The market reaction to an event can therefore reveal more than the event itself.
An earnings beat followed by continued selling may signal that valuation expectations, capital expenditure or future guidance matter more than the headline result.
An initially negative reaction that is quickly reversed, accompanied by improving breadth and lower volatility, would offer a different message.
5. THREE REALISTIC MARKET SCENARIOS
Scenario A — Technology recovery gains confirmation
Trigger: Federal Reserve communication avoids a materially more restrictive surprise, AI earnings support confidence in future returns, and Treasury yields stabilise.
Market consequence: Growth shares could regain leadership, while some defensive or energy-led relative performance moderates.
Confirmation: QQQ recovers approximately $720, SOX exceeds 11,100 and advances toward 11,450, and volatility eases alongside improving market breadth.
Invalidation: The rebound fails at resistance, semiconductor participation remains weak or yields rise sharply.
What to monitor: QQQ, SOX, VIX, the 10-year yield and the breadth of the recovery.
Strategically, this would justify reassessing the technology thesis — not declaring that the previous correction never mattered.
Scenario B — Energy continues to lead, but the market remains fragile
Trigger: Crude prices stay elevated, energy-sector earnings remain resilient and investors continue to question technology valuations.
Market consequence: Energy may outperform on a relative basis while broad equity returns remain uneven or negative.
Confirmation: XLE retains strength relative to QQQ, holds relevant short-term support and attracts continued participation.
Invalidation: Oil retreats substantially, XLE breaks down relative to QQQ, or energy-sector earnings fail to support expectations.
What to monitor: XLE/QQQ, crude oil, oil-company commentary and broad-market breadth.
This scenario supports selective observation of energy opportunities but not an indiscriminate commitment to all energy-related equities.
Scenario C — Inflation pressure produces a broader risk-off movement
Trigger: Oil remains elevated, inflation data surprise to the upside, yields rise and major technology companies fail to restore confidence.
Market consequence: Equity weakness broadens and correlations between previously distinct sectors increase.
Confirmation: QQQ and SOX establish new short-term lows, the VIX rises persistently above 20, and most sectors decline together.
Invalidation: Treasury yields ease, volatility retreats and buying becomes broad-based rather than concentrated.
What to monitor: Oil, the 10-year yield, VIX, earnings revisions and the number of sectors participating in declines.
In this environment, preserving financial flexibility can be more valuable than attempting to identify the next outperforming sector immediately.
No numerical probability is attached to these scenarios. Their value lies in identifying observable conditions that distinguish one developing market regime from another.
6. WHAT TO WATCH: FIVE SIGNALS THAT WILL DETERMINE OUR INTERPRETATION
1. Energy versus technology relative strength
Use the XLE/QQQ relationship to test whether energy continues to outperform technology. A rising ratio is useful only when examined alongside absolute sector performance.
2. Semiconductor confirmation
Watch SOX relative to its 11,100 and 11,450 reference levels. A broad technology recovery without semiconductor participation deserves greater scrutiny.
3. Volatility and Treasury yields
Monitor whether VIX remains around 19–20 or moves decisively higher, and whether the US 10-year yield remains close to 5%. A simultaneous rise would weaken the risk environment.
4. AI expenditure versus economic returns
Analyse earnings commentary from Microsoft, Alphabet and Amazon for capital expenditure, cloud growth, margins, free cash flow and evidence of AI monetisation. Strong spending is not the same as strong returns.
5. Market breadth beyond the headline index
Track how many S&P 500 sectors and constituents participate in advances. A market supported by only one or two groups is structurally different from one recovering across multiple industries.
Together, these observations provide the basis for updating the TITAN Market AMPEL and Sector Rotation AMPEL as the week develops.
7. OPTIONS AND SHORT-TERM POSITIONING: WHEN COMPLEXITY DOES NOT HELP
Periods of concentrated earnings and monetary-policy announcements frequently involve elevated uncertainty and changes in implied volatility.
That creates an important distinction between correctly forecasting the direction of a stock and profitably expressing that forecast through options.
An option buyer can correctly anticipate a rebound and still lose money if the realised movement is smaller than the premium implied, or if implied volatility declines after the event.
Short-dated options add sensitivity to timing, gaps and time decay.
Defined-risk structures can limit maximum contractual loss, but they do not eliminate the possibility of losing the entire amount at risk.
For this week’s research framework, the starting principle is therefore simple:
Use derivatives only when they provide a clearly identifiable advantage over a simpler, unleveraged expression of the thesis.
Avoiding unnecessary leverage can be particularly important when successive catalysts may invalidate an otherwise reasonable position before the original investment thesis has had time to develop.
Liquidity, position size and explicit invalidation criteria deserve priority over the pursuit of unusually high short-term returns.
8. OUR STRATEGIC CONCLUSION: DO NOT CONFUSE MOVEMENT WITH OPPORTUNITY
The week of October 26–30 is likely to test whether the market’s recent leadership changes represent temporary positioning or a more meaningful repricing of growth, inflation and risk.
Energy is the strongest identifiable relative candidate entering the week, but that strength is conditional and may partly reflect risks that are unfavourable for equities more broadly.
Technology remains important, but the evidence required for a durable recovery is not yet complete.
Our resulting approach is deliberately selective.
We prioritise observable confirmation over anticipation, relative and absolute performance over headlines, and explicit invalidation criteria over conviction without evidence.
The objective is not to predict every market move.
It is to distinguish market conditions in which taking risk has a defensible analytical basis from those in which waiting preserves more strategic flexibility.
WIEDER WAS GELERNT
The most transferable lesson from this week’s analysis is that the reason an investment is outperforming can matter more than the outperformance itself.
Investors frequently classify sectors as strong or weak and then assume that the strongest category offers the most attractive opportunity. Yet sector leadership is an outcome, not an explanation.
Energy stocks may rise because industrial demand is strengthening, because supply is restricted, or because geopolitical risks are increasing. Each explanation produces a different set of consequences for inflation, interest rates, company margins and other investments.
The same relative-strength chart can therefore support very different strategic conclusions.
A more useful analytical process begins by identifying the force behind the price movement, tracing its secondary consequences and determining what evidence would invalidate the interpretation.
This approach can be applied to technology, banking, commodities, currencies and virtually every other financial market.
The most valuable signal is often not where prices are moving, but why that movement is occurring — and what it changes next.
Disclaimer
This publication contains general financial-market research and analytical discussion prepared by FRL DEEP RESEARCH for informational and educational purposes only. It does not constitute investment advice, financial advice, portfolio management, or a recommendation to buy or sell any security, derivative, ETF or other financial instrument.
Market observations, scenarios and illustrative price levels are subject to change. Financial instruments, especially leveraged products and derivatives, involve the risk of substantial or total loss. Investment decisions remain the responsibility of the individual investor.