 LWAYS OPEN

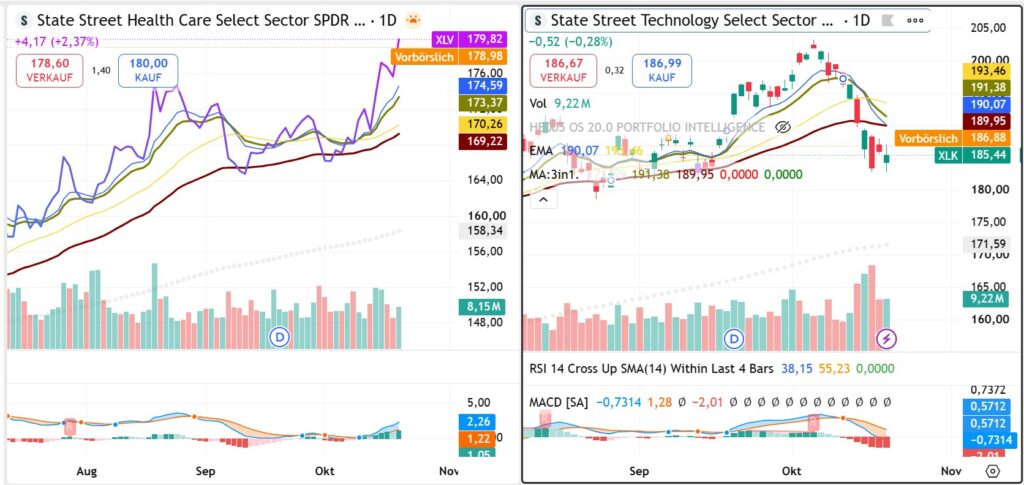
The next opportunity may not be where the market is falling — but where leadership is quietly changing. FRL introduces a Sector Rotation Traffic Light that combines relative strength, absolute performance, market conditions and risk assessment to distinguish genuine opportunities from misleading signs of outperformance.
The Market Can Change Leadership Without Changing Direction
The most dangerous mistake in sector rotation is to confuse outperformance with an investment opportunity.
A healthcare ETF can outperform semiconductors while both are losing money. Consumer staples can rally because investors are frightened, even as their valuations become increasingly demanding. In both cases, the apparent winner may be a poor trade.
This distinction has become especially relevant in October 2026.
On October 20, the Dow Jones Industrial Average gained 1.02%, the S&P 500 advanced 0.28%, and the Nasdaq Composite slipped 0.02%. Healthcare led the S&P 500’s sectors, while technology was its principal drag. The market was not uniformly weak. Leadership was changing beneath the headline indices.
Reuters
+1
The obvious conclusion is that investors should rotate from technology into defensive sectors.
But that conclusion skips the most important question: Are new sectors developing sustainable buying momentum, or are they simply losing less money as investors reduce risk?
For Final Resurrection Limited and the TITAN Options Circle, this is the reason to expand our existing market-monitoring framework with a new Sector Rotation Ampel — a systematic traffic-light assessment of changing market leadership.
Its purpose is not to predict tomorrow’s winning sector. It is to establish when a change in leadership becomes sufficiently convincing to deserve closer investigation.
1. Why Sector Rotation Deserves a Place in Our Market Analysis
Traditional market commentary concentrates on broad indices. The Nasdaq rises, the S&P 500 falls, or semiconductor stocks enter a correction.
Yet these observations can conceal important developments.
A market may appear directionless while substantial differences emerge between industries. Healthcare companies may advance, consumer staples may attract defensive interest, financials may benefit from their own earnings developments, and technology stocks may lose momentum.
Research by S&P Dow Jones Indices documents significant differences in performance across sectors and examines their usefulness as building blocks for both strategic and tactical market exposure. But identifying differences after they occur is not the same as identifying useful opportunities ahead of time.
S&P Dow Jones Indices
Our central research question is therefore:
Can we systematically identify sectors developing stronger momentum before that leadership becomes obvious in the headline indices — without confusing defensive resilience with a genuine bullish opportunity?
We believe the answer requires combining four analytical dimensions:
- Relative strength: Which sectors outperform the broader market and competing sectors?
- Absolute momentum: Are those outperforming sectors actually advancing?
- Market environment: Do volatility, bond yields, semiconductor leadership and market breadth support the move?
- Trade quality: Is there a rational entry, identifiable invalidation point and sufficient potential reward for the risk?
No single indicator can reliably answer all four questions.
That is precisely why our new traffic light is designed as a multi-layered assessment rather than a simple sector ranking.
2. What the October 2026 Market Is Telling Us
Recent developments provide a useful example of why this matters.
Reuters reported on October 16 that global equity funds attracted approximately $20 billion in net inflows during the week ending October 14, while technology-sector funds experienced around $4.75 billion in net outflows.
This was not a uniform withdrawal from equities. Investors were becoming more selective about their exposure.
Reuters
By October 20, several important observations had emerged:
| Market observation | Strategic interpretation |
|---|---|
| Healthcare led the S&P 500’s sectors | Evidence of emerging relative leadership |
| Technology weakened while the S&P 500 advanced | The headline index concealed substantial performance differences |
| Financials, real estate and utilities gained | Strength was not limited to one defensive sector |
| Value outperformed growth | An additional indication of changing market preferences |
| Small caps advanced strongly | Broader participation was possible despite technology weakness |
These observations are documented in Reuters’ October 20 market report.
Reuters
However, the same information supports more than one interpretation.
Interpretation A: A sustainable expansion of market leadership is developing.
Interpretation B: Investors are moving toward defensive and less technology-dependent exposures while the underlying market remains vulnerable.
Interpretation C: The apparent rotation is a temporary adjustment before technology resumes leadership.
All three are plausible. None should be treated as established merely because a few sectors have outperformed.
The purpose of the TITAN Sector Rotation Ampel is to identify which interpretation is gaining observable support.
3. Introducing the TITAN Sector Rotation Ampel
Our existing TITAN market assessment monitors four major indicators:
| Existing market indicators | What they help us understand |
|---|---|
| Nasdaq / QQQ | Growth-stock momentum and broad technology-related risk appetite |
| Philadelphia Semiconductor Index (SOX) | Semiconductor leadership and pressure within a major technology industry |
| VIX | Market-implied expectations of near-term volatility |
| U.S. 10-year Treasury yield | The interest-rate environment affecting valuations and financing conditions |
The VIX measures expected S&P 500 volatility derived from option prices, rather than forecasting the market’s direction. The Treasury yield adds a separate perspective on discount rates and financial conditions.
Cboe
+1
The new Sector Rotation Ampel adds a fifth analytical dimension: where relative market leadership is moving.
For the initial implementation, we use the 11 established U.S. equity sectors, represented by State Street’s Select Sector ETFs.
State Street
| Sector | Monitoring instrument |
|---|---|
| Technology | XLK |
| Healthcare | XLV |
| Consumer Staples | XLP |
| Financials | XLF |
| Industrials | XLI |
| Energy | XLE |
| Utilities | XLU |
| Consumer Discretionary | XLY |
| Communication Services | XLC |
| Materials | XLB |
| Real Estate | XLRE |
Semiconductors (SMH) and biotechnology (XBI) are useful additional industry-level instruments. They should not be confused with separate GICS sectors.
How the traffic lights work
GREEN — Confirmed relative leadership
A sector shows positive absolute performance, outperforms its benchmark across multiple observation windows, and has supportive price structure and participation. It qualifies for a closer opportunity assessment, subject to the overall market-risk filter.
YELLOW — Emerging or conflicting evidence
Relative performance is improving, but momentum, breadth or market conditions have not confirmed a durable trend. The sector remains under observation rather than automatically qualifying as a trading opportunity.
RED — Weakness or deteriorating leadership
Persistent underperformance, negative price momentum or weakening participation suggests an unattractive environment for initiating an unhedged bullish position.
These are proposed research classifications, not claims that a particular combination of indicators has already demonstrated predictive accuracy in a backtest.
Crucially, a GREEN sector signal does not override a RED general-market signal. A relatively strong sector can still experience substantial losses during a market-wide selloff.
4. The TITAN Method: From Observation to an Action Framework
A useful research model must produce a consistent interpretation of market conditions rather than a collection of disconnected indicators.
Our analytical sequence is:
01
FACT
02
SIGNAL
03
IMPLICATION
04
ACTION
An observation becomes actionable only after it has passed the necessary analytical checks.
FACT: Healthcare outperforms technology during a period of semiconductor weakness.
SIGNAL: The healthcare-to-technology relative-strength ratio rises. Healthcare also advances in absolute terms, ideally with improving participation across its constituent stocks.
IMPLICATION: Investors may be assigning greater value to healthcare’s earnings characteristics or reducing their exposure to technology-sensitive risks.
ACTION FRAMEWORK: Examine healthcare securities for a defined setup, check whether the broader market supports the proposed direction, and establish an entry condition and invalidation point before considering exposure.
If healthcare outperforms solely because technology falls faster, the interpretation changes fundamentally.
The fact of relative outperformance remains true. The case for a bullish trade becomes much weaker.
How we intend to measure confirmation
A practical first version compares sector performance over five and twenty trading days with the S&P 500, using consistent return definitions. It also examines the sector’s absolute return, its position relative to a 20-day moving average, and the proportion of its constituents participating in the advance.
The exact observation windows and classification rules are preliminary design parameters. They must be evaluated for false signals, transaction costs, changing volatility and sensitivity to market conditions before being treated as a validated trading model.
The daily assessment is designed to identify possible opportunities over approximately two to ten trading days, rather than predict long-term sector returns.
5. THE SECOND-ORDER EFFECT: The Safest-Looking Sector May Become the Most Vulnerable
One particularly revealing development illustrates why the second analytical step matters more than the headline.
An October 21 MarketWatch analysis reported that the S&P 500 Consumer Staples sector had advanced nearly 9% during October, while technology had fallen approximately 3.8%. It also reported forward price-to-earnings ratios of 23.8 for consumer staples and 19.8 for technology, based on the valuation comparison used in that report.
MarketWatch
These are striking observations.
Consumer staples are generally associated with comparatively stable demand. Investors often turn toward such businesses when economic uncertainty increases.
But defensive earnings characteristics do not guarantee attractive investment valuations.
Consider the sequence.
First, concerns about technology valuations, AI investment economics or financing costs prompt investors to look elsewhere.
Second, relatively defensive businesses attract demand, and their share prices appreciate.
Third, rising prices reduce future expected returns unless earnings estimates improve sufficiently.
Fourth, an unexpectedly positive development in technology could reverse the relative preference, placing pressure on previously successful defensive positions.
In other words, the very rotation that makes a sector attractive can eventually reduce the attractiveness of buying it.
This is where risk/reward asymmetry develops.
An early improvement in relative strength, accompanied by positive absolute momentum and reasonable valuations, may offer a better analytical starting point than a mature advance driven by increasingly crowded defensive positioning.
There is an important distinction, however: we cannot establish from sector prices alone whether positioning has become crowded. That requires additional evidence, such as fund flows, valuation changes, holdings concentration or positioning data.
This leads to one of the core principles of our research:
Sector rotation should be assessed not only by where leadership is moving, but also by how much of the investment case may already be reflected in prices.
The market may correctly identify a safer business model and nevertheless overpay for that safety.
6. Four Market Scenarios — and How We Would Interpret Them
We do not assign invented probabilities to these outcomes. Instead, each scenario has observable conditions that could strengthen or invalidate it.
| Scenario | Trigger and consequence | Confirmation | Invalidation |
|---|---|---|---|
| Orderly broadening | Technology consolidates while healthcare, financials, industrials and other sectors contribute positively to index performance | Positive sector breadth, several sectors advancing above their trend measures, stable volatility | Participation narrows and additional sectors turn negative |
| Defensive rotation | Technology underperforms while staples, healthcare and utilities attract relative interest | Sustained defensive outperformance and softer growth leadership | Technology regains leadership or defensives begin falling in absolute terms |
| General risk reduction | Volatility increases and investors cut equity exposure across most sectors | Rising VIX, deteriorating breadth, widespread negative absolute returns | Volatility eases and multiple sectors establish sustained positive trends |
| Technology leadership recovery | Semiconductor selling pressure subsides and investors reassess growth earnings expectations | SOX and technology regain relative strength, with improving breadth and positive price momentum | Semiconductor rebounds fail and selling pressure returns |
The important point is that all four scenarios can initially produce similar movements in one relative-strength chart.
A rising healthcare-to-technology ratio does not by itself tell us whether we are witnessing an orderly market rotation, defensive caution or the beginning of a broader correction.
The overall TITAN market assessment provides the additional context.
7. WHAT TO WATCH — Five Signals That Matter
For the daily Sector Rotation Ampel, we intend to prioritize five observable signals.
1. Persistent relative-strength improvement. A sector should ideally outperform the S&P 500 on both short and intermediate observation windows, rather than appear strong solely because of a single exceptional trading session. We will monitor five-day and twenty-day relative performance.
2. Positive absolute momentum. Outperformance becomes materially more interesting when the sector itself advances and maintains a constructive price structure. A rising ratio with a falling numerator is a warning against assuming bullish leadership.
3. Breadth beneath the sector index. Leadership supported by an increasing proportion of constituent stocks is more convincing than a sector move driven by one or two dominant companies. Constituent participation above relevant moving averages provides a measurable test.
4. Volatility and interest-rate confirmation. We will assess the VIX alongside changes in the U.S. 10-year yield. Rising volatility, abrupt yield changes or deteriorating market breadth may undermine otherwise promising short-term signals.
5. Semiconductor stabilization or further deterioration. SOX remains strategically important because semiconductor weakness can affect the broader growth-stock environment. Continued underperformance could strengthen the case for caution, while sustained stabilization could help support a technology recovery.
These indicators are designed to reveal changes in market conditions. They do not independently establish causation, predict capital flows or guarantee future performance.
8. From Sector Leadership to a Short-Term Trading Radar
Our research process should not end with identifying an attractive sector. It should distinguish a promising market environment from a specific, sufficiently well-defined opportunity.
For example, three instruments merit different types of observation in the current environment.
| Research candidate | Potential setup | Essential condition |
|---|---|---|
| XLV — Healthcare | Relative-leadership continuation or a constructive pullback | Positive absolute momentum and sustained relative strength |
| XBI — Biotechnology | Industry-level momentum following a confirmed breakout | Broad participation and a valid breakout rather than an isolated surge |
| SMH — Semiconductors | Potential recovery after selling pressure subsides | Stabilization, improving relative performance and confirmation that a rebound is holding |
These are monitoring candidates, not verified trade entries or buy recommendations.
The distinction between XLV and XBI is especially important. Both are healthcare-related, but their exposures and risk characteristics differ considerably. A broad healthcare rally does not imply that biotechnology will move identically.
Evaluating a potential setup
For a short-term opportunity to qualify for further consideration, our framework should establish:
- An observable entry trigger, such as a confirmed breakout or a successful retest.
- A technical invalidation level, rather than an arbitrary loss tolerance.
- A plausible objective supported by market structure.
- An acceptable ratio of potential reward to the distance from entry to invalidation — preferably at least 2:1 before costs.
- Compatibility with the overall market-risk assessment.
A nominal 2:1 reward/risk ratio does not establish positive expected value. The probability of success, trading costs, slippage and the likelihood of reaching the objective also matter.
For derivatives, implied volatility, bid-ask spreads, time decay, liquidity and contract-specific risks introduce additional considerations. Defined-risk structures can limit contractual losses, but they do not turn an uncertain directional view into a reliable trade.
In some cases, the strongest analytical conclusion may be that no new trade is justified.
9. How the New Ampel Fits into TITAN’s Daily Market Assessment
The practical objective is to include sector rotation within our regular GENERAL MARKET CONDITIONS — GENERELLE MARKTLAGE research.
The resulting daily assessment is intended to have three connected parts.
TITAN | Daily Market Intelligence
Conceptual structure — not a live market reading
A. Overall Market Conditions
NASDAQ / QQQ
SOX
VIX
US10Y
Establish whether the broader environment is supportive, fragile or hostile to taking directional risk.
B. Sector Rotation Ampel
Confirmed leaders
Developing
Weak
Rank sector momentum, relative strength, absolute performance and participation.
C. Short-Term Opportunity Radar
CANDIDATE
Sector / instrument
TRIGGER
Confirmation level
RISK
Invalidation / reward
Identify up to three candidates for independent assessment, including the possibility that none qualifies.
The model is deliberately structured to move from a broad market diagnosis toward a narrower opportunity investigation.
A sector can receive a favorable relative-strength classification while the overall market remains unfavorable for new directional exposure.
That apparent contradiction is not a failure of the system. It is useful information.
For instance, if technology is falling sharply and healthcare is merely holding steady, the Sector Rotation Ampel may identify healthcare as relatively stronger. The market-risk assessment may nevertheless indicate that waiting for positive absolute momentum offers a more defensible framework.
The final daily output should explain these distinctions rather than conceal them behind a single colour.
10. What We Must Test Before Calling This an Investment Edge
A disciplined methodology is more valuable than a visually impressive dashboard.
Before making performance claims, the proposed TITAN rules require systematic historical evaluation, including different market environments, realistic trading costs, ETF tracking differences, corporate-action-adjusted data and out-of-sample results.
We also need to distinguish data that directly measures investment-fund subscriptions or redemptions from relative price movements. Relative strength can suggest changing preferences, but it cannot establish where investors’ money is flowing.
The first version of the Ampel should therefore be treated as a structured research and monitoring framework.
Its value lies initially in consistency, transparency and the ability to challenge assumptions. Whether particular combinations of signals deliver attractive trading outcomes remains an empirical question.
That is an important distinction for TITAN: a stronger decision process can be developed and evaluated without claiming to have discovered a predictive advantage that has not yet been demonstrated.
Conclusion — Recognising Change Without Chasing It
The semiconductor correction has highlighted an opportunity to improve how we interpret the equity market.
Rather than treating weakness in technology as an isolated event, we can examine how other sectors behave, whether their leadership is genuine, and what that tells us about the underlying market environment.
Our new Sector Rotation Ampel is designed to make those observations part of a repeatable research process.
The objective is not to buy whichever sector recently performed best.
It is to identify when relative leadership, positive momentum, market conditions and a defensible risk framework begin to align — and to recognise when they do not.
For Final Resurrection Limited and the TITAN Options Circle, this represents a further development of our analytical approach: moving from monitoring market direction toward evaluating the changing structure of the market itself.
WIEDER WAS GELERNT
One of the most important lessons in investing is that strength is always relative to something — but successful investment outcomes are not.
A sector can become the strongest part of a weakening market without becoming an attractive place to assume additional risk. Equally, a sector that has recently underperformed may be approaching a meaningful recovery before that change appears in a broad index.
The error is to treat relative performance as a complete investment thesis.
The more useful approach is to ask three separate questions: Is the sector outperforming? Is it actually advancing? And does the broader market environment support the continuation of that strength?
This distinction becomes especially valuable when markets rotate rapidly between growth, defensive and cyclical exposures.
The transferable lesson is not that investors should follow sector rotation mechanically. It is that changes in leadership deserve attention only when their underlying causes, confirmation signals and risks are understood.
The market’s strongest sector is not necessarily its strongest opportunity.
Disclaimer
This article provides general financial-market research and analytical discussion for informational and educational purposes only. It does not constitute investment or financial advice, portfolio management, or a recommendation to buy or sell any security, ETF, option, derivative or other financial instrument. Market interpretations and scenarios are uncertain and may change without notice. The TITAN Sector Rotation Ampel is a developing analytical framework, not a validated prediction or trading system. All investment decisions and their associated risks remain the responsibility of the individual investor.