 LWAYS OPEN
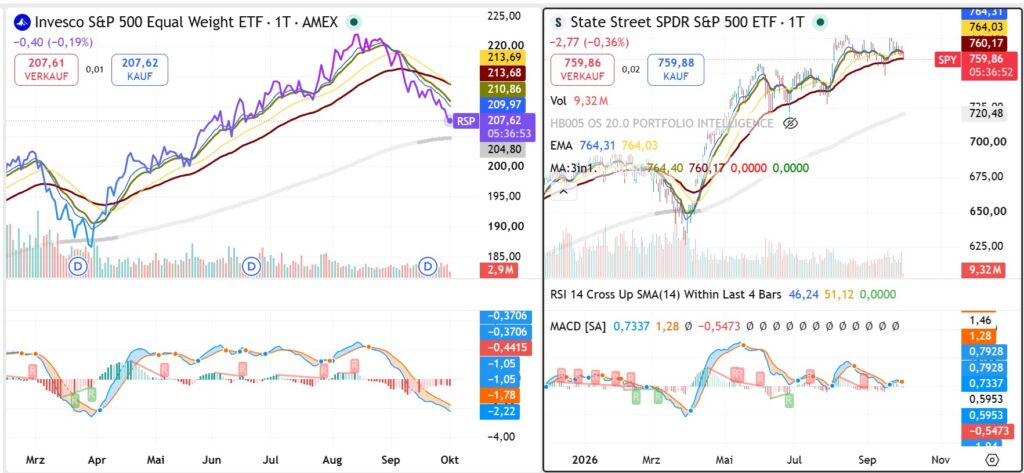
The S&P 500 remains close to record territory, but September left most stocks behind. The divergence is unusually severe — and tomorrow’s employment report may reveal whether this is temporary concentration or the beginning of a more consequential change in market regime.
THE INDEX IS HIDING SOMETHING
The most important fact about the U.S. equity market entering October is not that the S&P 500 remains close to its record high.
It is that most of the stocks inside it are behaving as if the market were considerably weaker.
During September, approximately 78% of S&P 500 constituents declined. Roughly 60% lost at least 5%, while 27% fell more than 10%. The equal-weighted S&P 500 fell approximately 4.4%, even as the capitalization-weighted index finished the month with only a modest decline. Nine of the eleven S&P sectors lost ground.
By Tuesday, only 40.8% of S&P 500 stocks remained above their 200-day moving averages. Other breadth measures were even more extreme: research cited by Business Insider showed fewer than 25% of constituents above their 50-day averages while the headline index remained less than 2% below its record.
That combination is the real September story.
The index has not broken.
Participation has.
And tomorrow’s U.S. employment report may tell us whether the market underneath the index can repair itself — or whether the headline index eventually has to catch down with its own constituents.
FACT: SEPTEMBER PRODUCED TWO DIFFERENT STOCK MARKETS
Look only at the major indices and September does not appear especially alarming.
The S&P 500 ended September at 7,651.54, down 0.3% on the final session and still up 11.8% for 2026. The Nasdaq Composite actually gained 0.2% on September 30 and remained the strongest of the major U.S. indices year-to-date. The Russell 2000 closed at 2,796.86.
Look underneath those indices and the picture changes.
The equal-weighted S&P 500 — where every constituent has approximately the same influence rather than allowing the largest companies to dominate — lost roughly 4.4% during September. The performance gap versus the capitalization-weighted index was the largest monthly divergence since March 2020.
This is not merely a technical curiosity.
It tells us where capital is willing to hide.
Large technology and AI-related companies remain capable of supporting the major indices even while a much larger portion of corporate America loses momentum.
That is why the market can simultaneously look resilient and fragile.
Both observations are correct.
They describe different parts of the same market.
REACTION: COOLER INFLATION DID NOT PRODUCE THE EXPECTED RELIEF
Wednesday gave investors an unusually useful experiment.
The August core PCE price index increased 3.0% year over year, below expectations reported around the release, while the two-year Treasury yield declined as investors reduced expectations for another immediate Federal Reserve rate increase.
Normally that combination should help rate-sensitive equities.
Initially, it did.
But the relief did not survive.
The 10-year Treasury yield moved in the opposite direction, rising toward 5.3%, around its highest level in more than two decades. The S&P 500 subsequently reversed and closed 0.3% lower; the Dow lost 0.9%, while the Nasdaq managed a small gain.
This reaction matters more than the PCE headline.
If softer inflation were sufficient to remove the market’s principal constraint, long-duration yields should have fallen meaningfully and broader equities should have responded.
They did not.
The market therefore appears to be distinguishing between two different interest-rate problems:
Federal Reserve policy risk
and
long-term bond-market risk.
The first diminished.
The second did not.
THE DIVERGENCE THAT MATTERS: THIS MAY BE A BOND-MARKET BREADTH PROBLEM
This is the connection that conventional market commentary risks missing.
September’s breadth deterioration and the Treasury selloff should not be analysed separately.
They may be manifestations of the same underlying pressure.
The 10-year Treasury yield rose more than half a percentage point during September and ended the month around 5.3%. U.S. government bonds suffered their worst month in years, while the 30-year yield reached levels not seen for more than two decades.
Higher long-term yields do not affect every equity equally.
Companies with exceptional earnings growth, dominant AI exposure, strong balance sheets and large free cash flows can continue attracting capital despite higher discount rates.
The broader market has less protection.
Smaller companies generally depend more heavily on external financing.
Highly leveraged businesses face refinancing pressure.
Rate-sensitive sectors encounter higher capital costs.
Long-duration but lower-quality growth becomes more difficult to justify.
The result can be exactly what September produced:
the index remains resilient while the median stock deteriorates.
This gives us a more useful interpretation of the breadth divergence.
It may not simply mean:
“investors are too concentrated in mega-cap technology.”
It may mean:
“the cost of capital has risen enough that investors increasingly demand exceptional earnings quality before accepting equity risk.”
That is a much more consequential signal.
THE MARKET INTELLIGENCE EDGE: TOMORROW IS REALLY A BOND TEST
The September jobs report is expected on Friday.
Reuters surveys ahead of the release have clustered around approximately 90,000–100,000 additional nonfarm payrolls, with unemployment expected around 4.1%–4.2%, depending on survey timing.
But the payroll number itself is not the most interesting variable.
The sequence matters:
jobs data
→ Fed expectations
→ Treasury yields
→ equity breadth
→ index confirmation or divergence.
That gives tomorrow’s report unusual analytical value.
A weaker employment report that sends Treasury yields materially lower and produces broad participation would be constructive.
Not because weak employment is inherently good.
Because it would show that the interest-rate constraint suppressing the broader equity market is beginning to loosen.
Conversely, suppose payrolls are softer but the 10-year Treasury yield refuses to decline.
That would be a much more important warning.
It would suggest that the long end is increasingly being driven by forces that weaker economic data cannot easily solve — fiscal concerns, Treasury supply, inflation risk premia or structural selling pressure.
The distinction is crucial.
A Fed problem can potentially be solved by weaker economic data.
A term-premium or sovereign-bond problem may not be.
WHY THE JOBS NUMBER ALONE CAN MISLEAD
There are at least four plausible market reactions tomorrow.
SOFTER JOBS + LOWER US10Y + BROADER EQUITY RALLY
This would be the cleanest breadth-repair signal.
Russell 2000, equal-weight S&P and rate-sensitive sectors should participate rather than leaving the rally entirely to mega-cap technology.
Signal: September’s divergence may have been primarily rate-driven and potentially reversible.
STRONG JOBS + HIGHER US10Y + NARROWER MARKET
This would reinforce September’s existing pattern.
Economic resilience would keep pressure on rates, while capital could continue concentrating in companies considered capable of growing through expensive money.
Signal: breadth deterioration remains unresolved.
WEAK JOBS + HIGHER OR UNCHANGED US10Y
This is arguably the most important adverse scenario.
Normally weaker employment should reduce yields.
If long yields remain elevated regardless, investors would have evidence that the Treasury selloff has become increasingly independent of the Fed cycle.
Signal: equity investors would face slower growth without corresponding relief in discount rates.
That is a considerably less comfortable combination.
STRONG JOBS + STABLE/FALLING US10Y + BROAD RALLY
This would be the strongest economic interpretation.
It would suggest that the market can absorb evidence of economic strength without demanding materially higher long-term yields.
Signal: the market’s tolerance for growth has improved, weakening the September breadth warning.
WHY SMALL CAPS MATTER TOMORROW
The Russell 2000 should be treated as more than another index.
It is part of tomorrow’s diagnostic test.
If yields decline but mega-cap technology again captures almost all of the upside while smaller companies fail to participate, the breadth problem has not been solved.
Likewise, an S&P 500 rally led by five or ten giant companies would not invalidate September’s warning.
We need to see participation.
The same applies to the equal-weight S&P 500.
The capitalization-weighted index answers:
What are the largest U.S. companies doing?
The equal-weight index answers something closer to:
What is the typical large U.S. company doing?
September showed an unusually large disagreement between those two answers.
Tomorrow gives the market an opportunity to reconcile them.
SEMICONDUCTORS PROVIDE ANOTHER IMPORTANT CHECK
The semiconductor complex occupies an unusual position in this market.
It contains some of the strongest fundamental growth stories in the world, particularly around AI infrastructure, yet it is also highly sensitive to expectations about capital expenditure, growth and valuation.
That makes semiconductor participation useful confirmation.
A post-jobs rally in which AI leaders rise but the broader semiconductor complex and wider market remain weak would still represent narrow leadership.
A rally accompanied by improving semiconductor breadth, small-cap participation and stronger equal-weight performance would carry substantially more information.
The question is not whether Nvidia, Micron or another AI leader can rise.
We already know exceptional companies can outperform this environment.
The question is whether risk appetite can spread beyond exceptional companies.
WHAT TO WATCH NEXT
1. US 10-YEAR TREASURY YIELD
This is the first variable to watch after the jobs release.
The yield ended September around 5.3%, after a powerful monthly rise.
Confirmation of breadth repair: yields decline meaningfully and remain lower after the initial reaction.
Warning: yields briefly fall and then reverse higher.
Stronger warning: weak payrolls fail to push long yields lower at all.
The reaction may tell us more than the employment number.
2. EQUAL WEIGHT VERSUS CAP WEIGHT
Watch whether equal-weighted equities begin outperforming the standard S&P 500.
September’s roughly 4.4% decline in the equal-weight index created the core divergence this report is tracking.
One positive session is insufficient.
What matters is whether relative performance begins establishing a sustained reversal.
3. RUSSELL 2000
Small caps are particularly useful because higher financing costs affect them more directly than cash-rich mega-caps.
A falling US10Y combined with Russell 2000 outperformance would support the breadth-repair thesis.
Falling yields without small-cap participation would be considerably less convincing.
4. PERCENTAGE OF S&P 500 STOCKS ABOVE THEIR 200-DAY AVERAGE
The recent reading of 40.8% is difficult to reconcile with an index sitting close to record territory.
This is therefore one of the cleanest measures of whether participation is actually recovering.
The bull case needs the number to broaden materially — not merely the S&P 500 to rise.
5. SOX / SEMICONDUCTOR PARTICIPATION
Semiconductors remain the bridge between AI leadership and broader cyclical growth.
If SOX strengthens alongside improving equal-weight and small-cap performance, the signal is substantially healthier than another isolated mega-cap AI rally.
CONCLUSION: DO NOT ASK WHETHER THE JOBS REPORT IS GOOD OR BAD
September left investors with an unusual market.
The major index remains near its highs.
The majority of its stocks do not.
That divergence does not guarantee a correction. Narrow markets can remain narrow for surprisingly long periods when a small number of companies produce sufficiently superior earnings growth.
But narrowing breadth becomes more consequential when it occurs simultaneously with rapidly rising long-term yields.
That is why tomorrow matters.
The September employment report will provide a new economic datapoint.
More importantly, it will create a controlled test of the market’s internal structure.
Watch the bond market first.
Then watch whether equity participation broadens.
Only then look at the headline index.
If yields fall and breadth expands, September’s warning begins to lose force.
If yields remain elevated and another handful of mega-caps keep the index afloat while most stocks struggle, the divergence remains unresolved.
And if weak economic data cannot bring long-term yields down, the message becomes more serious:
the problem may no longer be the Fed.
WIEDER WAS GELERNT
A market index is a price, not a vote.
When a handful of very large companies dominate capitalization-weighted indices, the S&P 500 can remain near a record even while most constituent stocks are declining. That does not automatically predict a correction, but it changes what investors should measure.
The transferable lesson is to read important economic releases in sequences rather than headlines. Tomorrow’s payroll number matters less in isolation than the chain it creates: employment → rate expectations → Treasury yields → market breadth → index response.
If the economic headline changes but the supposedly affected market variable refuses to move, that resistance contains information. It tells us that another force may have become dominant.
That principle works far beyond employment reports.
The most revealing market signal is often not what moves after the news — but what should have moved and did not.
DISCLAIMER
General financial-market research and market intelligence for informational purposes only; not investment advice or a recommendation to buy or sell any financial instrument.