 LWAYS OPEN

Why Global Payments’ November 12, 2026 selloff is less about a withdrawn takeover than the company’s ability to convert Worldpay synergies, adjusted earnings and financial scale into sustainable cash for shareholders.
FRL DEEP RESEARCH
Final Resurrection Limited
Investment Research – Analytical Market Studies
12 November 2026 | Research cut-off: approximately 20:50 CET
The Real Question Is Not Why the Buyers Walked Away
Global Payments lost approximately a tenth of its equity-market value in a matter of minutes on November 12. Yet the more revealing figure is not the size of the decline. It is the approximately $4 billion of annual free cash flow that management has previously indicated the company could generate in 2027.
At roughly $90 per share, Global Payments appears inexpensive relative to its adjusted earnings. The market’s hesitation becomes more understandable when that apparent bargain is measured against $22.54 billion of reported corporate debt, a complicated post-acquisition cash-flow statement and a continuing programme of technology investment and integration spending.
The latest quarterly results show two seemingly incompatible realities: $870 million of adjusted free cash flow, but approximately $393 million of negative reported operating cash flow after capital expenditure.
Both figures can be accurate. Neither tells the complete story independently.
The crucial question is whether their divergence reflects temporary transaction-related payments or economic costs that will continue absorbing cash long after the Worldpay acquisition is complete.
The collapse of the potential private-equity buyout has made that distinction impossible to ignore.
Global Payments is now being valued less as a takeover candidate and more as a highly leveraged operating business whose future equity value depends on the quality, timing and allocation of its cash generation.
1. What Happened on November 12?
On October 30, Reuters reported that Clayton, Dubilier & Rice was exploring a potential acquisition of Global Payments, with GTCR identified as a possible consortium partner.
The company’s shares rose more than 11% following the initial reports. The possibility of a substantial leveraged buyout introduced an additional source of demand for the equity, independent of the existing operating outlook.
On November 12, Reuters reported that the two private-equity firms had abandoned their preliminary pursuit. Sources familiar with the discussions attributed the decision to the complexity of financing a transaction of this magnitude.
The report emerged around the time of the dramatic market reaction, shortly after 18:00 Central European Time.
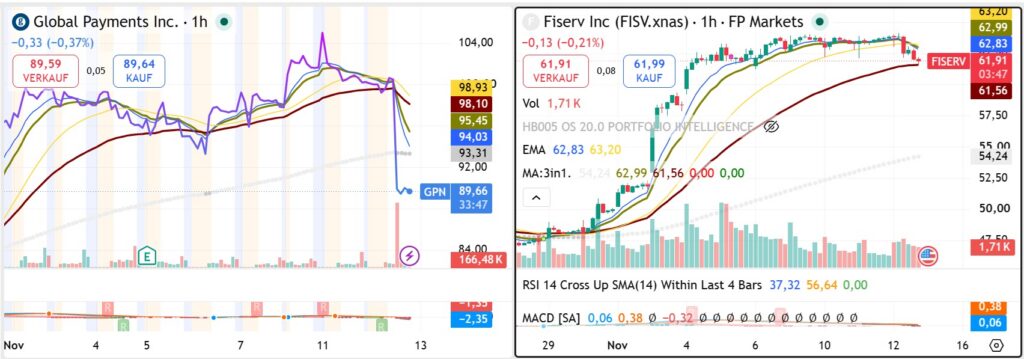
The supplied intraday charts show the stock falling from approximately $100 toward $90, briefly trading below $88 before recovering part of the decline.
A temporary volatility-related trading halt was reported.
The withdrawal was therefore the identifiable immediate catalyst.
However, the reported explanation does not support several stronger conclusions that investors might be tempted to draw.
It does not establish that Global Payments’ business deteriorated on November 12.
It does not establish that GTCR discovered a previously unknown problem.
And it does not demonstrate that the company is worth less than its trading price before the original takeover speculation.
The discussions were preliminary. No binding acquisition agreement or agreed purchase price had been publicly announced.
FRL interpretation: The market removed a contingent acquisition premium while reassessing the difficulty of financing the company’s substantial enterprise value.
The abandoned deal is informative about transaction financing conditions. It is not a substitute for fundamental valuation.
2. The Operating Business Is Performing Better Than the Selloff Suggests
Global Payments’ November 5 quarterly results do not indicate an immediate collapse in underlying operating performance.
| Q3 2026 measure | Reported result |
|---|---|
| GAAP revenue | $3.31 billion |
| Adjusted net revenue | $3.18 billion |
| Normalized adjusted net revenue growth | More than 4% |
| Adjusted operating margin | 42.5% |
| Normalized adjusted margin expansion | 220 basis points |
| Adjusted diluted EPS | $3.58 |
| GAAP diluted EPS | $1.06 |
Management reaffirmed its full-year adjusted EPS guidance of $13.60–$13.80 and normalized constant-currency adjusted net revenue growth guidance of approximately 4%–5%.
It also raised its targeted annual run-rate Worldpay expense synergies to $650 million by the end of 2028.
Three observations follow.
First, there is underlying growth. The normalized figures account for the changed business perimeter and are therefore more informative than the headline revenue increase following the Worldpay acquisition.
Second, operating efficiency is improving on management’s adjusted basis. Margin expansion suggests progress in combining operations and reducing expenses.
Third, management has not withdrawn its financial outlook. The November 12 market event did not coincide with a downward earnings revision.
Nevertheless, normalized revenue growth of approximately 4%–5% does not automatically justify a premium technology valuation.
Global Payments still operates in a competitive industry where the durability of pricing, customer retention and platform capabilities are crucial.
The investment case therefore requires a connection between the reported operating improvements and the cash that the business ultimately generates.
3. The Hidden Variable: The Cash-Flow Conversion Timetable
Why the timing of cash generation matters more than the headline earnings multiple
The most important issue is not that Global Payments reports cash that is temporarily associated with merchant settlement activity. That is a normal characteristic of payment processors.
The deeper issue is the time required for the company’s adjusted operating performance to become recurring cash flow after all necessary business expenditure.
This determines whether Global Payments can simultaneously:
- Complete its Worldpay integration.
- Maintain competitive technology investment.
- Meet debt and refinancing obligations.
- Reduce leverage.
- Return capital to shareholders.
These objectives are interdependent.
An enterprise with strong operating margins can still deliver disappointing equity returns if its cash generation is absorbed by a prolonged integration programme or by financing obligations.
Conversely, a temporary deterioration in reported free cash flow may be compatible with a fundamentally attractive business if large, identifiable nonrecurring payments are genuinely disappearing.
The distinction cannot be settled by comparing a single GAAP cash-flow figure with a single adjusted figure.
It requires a period-by-period reconciliation.
The evidence from Q3 2026
Global Payments’ third-quarter cash-flow performance can be reconstructed by subtracting the figures in its June 30 Form 10-Q from the nine-month figures in its September 30 Form 10-Q.
| Cash-flow measure | Q3 2026 |
|---|---|
| GAAP operating cash flow, derived | −$160.9 million |
| Capital expenditure, derived | $231.9 million |
| GAAP operating cash flow less capex | −$392.8 million |
| Management-reported adjusted FCF | +$870 million |
| Difference between FCF measures | Approximately $1.263 billion |
This approximately $1.26 billion difference is a reconciliation challenge, not evidence that $1.26 billion of operating cash has disappeared.
It includes adjustments associated with the company’s complicated restructuring and transaction-period cash flows.
Importantly, the cash-flow statements disclose another significant item.
The cumulative change in income taxes payable, as presented within operating cash flow, moved from positive $2.334 billion for the first six months to positive $1.124 billion for the first nine months.
The implied third-quarter movement is approximately negative $1.210 billion.
This is an unusually large cash-flow working-capital effect.
It is consistent with the company’s discussion of substantial transaction-related tax obligations, including the divestiture of Issuer Solutions.
However, the cash-flow-statement movement in taxes payable is not identical to total cash taxes paid. It must not be treated as a precise one-for-one reconciliation to adjusted free cash flow.
The two measures also differ in their treatment of other adjustments.
The significance is substantial: much of the apparent quarterly cash-flow deterioration may reflect the timing of transaction-related tax and liability settlements rather than a breakdown in the recurring economics of merchant processing.
But the existence of nonrecurring explanations does not make every adjustment economically irrelevant.
The integration-cost distinction
In Q3, the company excluded approximately $343.7 million of selling, general and administrative expenses when reconciling GAAP to adjusted operating income.
These expenses comprised:
| Q3 adjustment category | Amount |
|---|---|
| Acquisition, integration and separation | $222.4 million |
| Business transformation | $51.1 million |
| Employee termination benefits | $62.7 million |
| Other items | $7.5 million |
| Total | $343.7 million |
These are income-statement adjustments, not a disclosure that precisely $343.7 million was paid in cash during the quarter.
Some expenditure may have been accrued and paid in another period. Other elements may have different cash or noncash characteristics.
There is therefore insufficient evidence to conclude that all these expenses represent recurring operating cash losses.
Equally, it would be premature to exclude integration and transformation spending indefinitely.
Management expects these programmes to continue through 2028.
The investment question is when the reported cash-flow profile begins to resemble the normalized cash-flow profile—and how much ongoing investment is necessary to preserve that improvement.
4. A More Rigorous Free-Cash-Flow Framework
An investor evaluating Global Payments needs three related measures rather than one.
Reported free cash flow
Start with GAAP operating cash flow and subtract capital expenditure.
Under US GAAP, operating cash flow generally already incorporates cash interest, cash taxes and operating working-capital movements.
Those items must not be deducted a second time.
This measure captures actual cash generation and expenditure during the reporting period, but it may be distorted by major transactions and unusual payment timing.
Normalized operating free cash flow
Identify transaction-related payments, exceptional tax settlements, integration expenditure and temporary working-capital effects that are demonstrably nonrecurring.
Then determine which adjustments should be reversed for a sustainable operating estimate.
The calculation must also retain recurring platform maintenance, normal working-capital requirements, customer-acquisition costs and essential technology spending.
An expense is not economically exceptional merely because management classifies it as an adjustment.
Distributable corporate cash flow
Finally, determine how much normalized cash is available for discretionary uses after unavoidable obligations, necessary reinvestment and appropriate liquidity reserves.
This is the amount that can credibly support shareholder distributions and additional debt reduction.
For Global Payments, that third measure is especially important.
The business may generate strong adjusted cash flow before investors can confidently conclude that an equivalent amount is available for repurchases or deleveraging.
The distinction will become increasingly testable as the integration matures.
5. The 2027–2028 Cash-Flow Ambition: The Fundamental Valuation Test
Management has previously discussed expectations of more than $4 billion in free cash flow for 2027 and approximately $5 billion in adjusted free cash flow for 2028.
These are management’s forward-looking ambitions, not realized results. The specific definitions and assumptions must be considered, and they are not equivalent to a formal GAAP free-cash-flow forecast.
At the November 5 earnings call, management reported $870 million of adjusted free cash flow for the third quarter, equivalent to approximately 92% of adjusted net income.
It also continued to expect approximately 90% adjusted free-cash-flow conversion for full-year 2026.
This supports an important counterargument to the most pessimistic interpretation of the cash-flow statements.
The adjusted cash-conversion performance does not show an operating business whose ability to generate cash has collapsed.
But adjusted cash conversion is not the final economic test.
The full investment thesis depends on the trajectory of actual cash payments as extraordinary tax obligations and integration costs diminish.
The appropriate questions are:
Does reported free cash flow become consistently positive?
Does the reconciliation gap narrow without redefining previously recurring expenses as exceptional?
Does the company achieve its expected efficiency benefits without losing customer relationships?
And does the resulting surplus reduce financial risk rather than merely finance additional share repurchases?
If the answer to those questions becomes demonstrably positive, the equity’s present valuation could prove undemanding.
If the expected normalization is repeatedly deferred, the low adjusted earnings multiple may instead reflect substantial execution risk.
This is the distinction between a potentially mispriced restructuring and a business whose reported earnings overstate sustainable shareholder economics.
6. Liquidity and Debt: Correctly Separating Settlement Funds from Corporate Financing
Global Payments’ balance sheet contains another accounting issue that affects how its valuation should be interpreted.
At September 30, 2026:
| Balance-sheet item | USD billion |
|---|---|
| Reported cash and equivalents | 5.570 |
| Cash considered available for general purposes | 1.289 |
| Corporate long-term debt including current maturities | 22.536 |
| Settlement lines of credit | 1.168 |
| Settlement processing assets | 2.809 |
| Settlement processing obligations | 5.971 |
Approximately $4.281 billion of reported cash is excluded from management’s estimate of funds available for general corporate purposes.
The company attributes the difference to settlement-related cash, merchant reserves and certain customer funds.
These amounts are not necessarily legally restricted. However, they are economically associated with payment-processing obligations.
Cash held before settlement is generally expected to be passed to merchants or other entitled parties.
This creates two potential errors.
Error one: Deducting every dollar of reported cash from corporate financial debt as though all liquidity were freely deployable.
Error two: Removing settlement-related cash from a leverage calculation and then mechanically deducting settlement liabilities from corporate debt, without checking whether those liabilities were included in corporate debt in the first place.
The approximately $22.54 billion corporate long-term debt figure excludes the separately reported $1.17 billion of settlement credit lines.
Consequently, subtracting those settlement credit lines from a corporate-debt calculation would incorrectly remove debt that was never included.
A simple analytical estimate of corporate debt minus management-defined generally available cash produces approximately $21.25 billion.
That is useful as an illustration.
It is not the company’s official net-leverage calculation, nor does it provide a comprehensive enterprise-value reconciliation.
The balance sheet contains settlement-related assets, obligations, restricted cash, leasing items and other financial interests requiring consistent treatment.
The important economic point is not that Global Payments has an undisclosed liability.
It is that a payment processor’s balance-sheet cash must be analysed in relation to the obligations it supports.
7. Why the Equity Is More Sensitive Than the Operating Business
At approximately $90 per share and using the 264.6 million shares outstanding at September 30, Global Payments’ illustrative equity-market value is approximately $23.8 billion.
Adding the approximately $21.25 billion analytical corporate net-debt estimate produces an indicative enterprise value of roughly $45.1 billion before other relevant adjustments.
This is not a definitive valuation or an official company-reported enterprise value.
It does, however, demonstrate why the stock can be highly volatile even without a corresponding change in operating earnings.
Under this simplified capital structure, equity represents approximately 53% of enterprise value.
Holding the debt adjustment unchanged, a 10% change in enterprise value would translate into approximately a 19% change in equity value.
The relationship is illustrative rather than a price forecast.
It shows how financing leverage amplifies the response of the share price to changes in the perceived value of the operating business.
Why adjusted P/E is insufficient
At $90, the ratio of share price to management’s $13.70 adjusted EPS guidance midpoint is approximately 6.6 times.
This figure appears inexpensive.
However, it does not establish a bargain valuation.
The appropriate valuation framework should also examine enterprise value relative to normalized operating profitability, financing costs, continuing capital investment and sustainable cash flow.
A credible EV/EBITDA comparison requires consistent treatment of corporate overhead, discontinued operations, integration adjustments and settlement financing.
Applying an unsupported multiple to a poorly reconciled earnings figure would create false precision.
The same limitation applies to calculating an attractive free-cash-flow yield using management’s 2027–2028 ambitions as though they were already achieved.
A high projected cash yield may indicate an opportunity.
It may also measure the market’s skepticism about whether the projection will become reality.
8. Worldpay: Cost Synergies Are Only Half the Economic Story
The Worldpay acquisition is intended to create a larger, more integrated global merchant-payments business.
Management has raised expected annual run-rate Worldpay integration expense synergies from $600 million to $650 million by the end of 2028.
Separately, the company has discussed more than $650 million of annual run-rate operating-income benefits from its broader transformation programme by the first half of 2027.
These programmes have related objectives and have been combined operationally into a broader integration and transformation initiative.
The figures must not automatically be added together.
The appropriate question is how much incremental benefit is distinct, how much has already been achieved, and what expenditure is necessary to realize the remainder.
The competitive dimension
Global Payments competes across several markets with substantially different economics.
Large international merchants evaluate authorization rates, reliability, global reach, fraud technology and processing cost.
Software platforms value integration quality, embedded payments and distribution economics.
Small businesses increasingly seek bundled payment and business-management technology.
Competition from companies such as Adyen, Stripe and other specialist or integrated providers raises the importance of product architecture and customer experience.
A larger installed base does not automatically confer stronger pricing power.
Cost savings may improve short-term adjusted margins while deteriorating service levels or slower innovation weakens customer retention.
This creates a second-order risk.
If integration savings are achieved by reducing capabilities that customers value, the company could meet near-term synergy targets while undermining long-term revenue economics.
Conversely, successful platform consolidation could improve service quality, reduce infrastructure duplication and facilitate cross-selling.
The most important indicator is therefore not the announced synergy target alone.
It is the combination of realized cost savings, normalized revenue growth, customer retention and the capital expenditure needed to sustain those results.
9. Capital Allocation: Deleveraging and Buybacks Compete for the Same Cash
Management continues to target approximately 3.0 times net leverage by the end of 2027, compared with approximately 3.4 times at the end of Q3 2026.
It also expects approximately $1 billion of capital expenditure in 2026 and has reiterated plans for substantial shareholder capital returns.
The company reported more than $1.4 billion returned to shareholders during the first nine months of 2026.
Its SEC cash-flow statement records approximately $1.24 billion spent on ordinary share repurchases and $201 million of dividends during the period.
These capital returns exceeded reported operating cash flow after capex.
However, it would be inaccurate to conclude that every repurchased share was financed through new borrowing.
The group also received substantial proceeds from divestitures, maintained liquidity and undertook major acquisition-related debt transactions.
Cash is fungible, and the sources and uses must be examined together.
The relevant economic question is whether capital returns are sustainable once major asset-sale proceeds and other nonrecurring funding sources are excluded.
Debt maturity considerations
The September 30 filing identifies scheduled long-term debt maturities, excluding finance leases, of approximately:
| Year | Debt maturities |
|---|---|
| 2027 | $1.41 billion |
| 2028 | $3.76 billion |
| 2029 | $3.27 billion |
| 2030 | $4.96 billion |
Refinancing ability and the cost of future capital remain important.
The company does not face an immediate requirement to repay the entire $22.54 billion balance.
Nevertheless, recurring cash flow, ratings, refinancing conditions and financial flexibility determine how much equity value can ultimately be supported.
The strongest version of the investment case would combine improving cash conversion with visible net-debt reduction.
A weaker version would produce attractive adjusted EPS while continuing to rely on the balance sheet and temporary funding sources to support shareholder distributions.
10. GTCR: An Informed Shareholder, Not an Automatic Bearish Signal
GTCR’s involvement makes the November 12 development more informative than an ordinary abandoned acquisition proposal.
GTCR was a major previous investor in Worldpay and received 43.27 million Global Payments shares as part of the January 2026 transaction.
The original transaction filing reported a beneficial ownership interest of approximately 15.45% on the relevant post-issuance share base.
GTCR therefore had substantial economic exposure to the combined business.
But its reported participation in unsuccessful takeover discussions should not be treated as proof that it lacks confidence in Global Payments’ operating future.
A financial sponsor may decline to support a leveraged acquisition because the financing structure, return expectations or risk allocation are unattractive.
That is different from concluding that the underlying company is fundamentally impaired.
A measurable future market variable: the lock-up schedule
The January 2026 shareholders agreement provides a phased release of GTCR’s original stock consideration, subject to contractual exceptions.
| Contractual anniversary | Portion released from lock-up |
|---|---|
| January 9, 2027 | 35% |
| April 9, 2027 | Additional 15% |
| July 9, 2027 | Remaining 50% |
This does not mean GTCR will sell those shares.
It establishes when restrictions on transfers are scheduled to diminish.
The distinction matters because a significant potential seller may influence supply expectations even when no actual sale has been announced.
A substantial sale could increase trading pressure independently of the operating results.
Conversely, continued ownership or an orderly placement could remove uncertainty.
The Elliott consideration
Bloomberg reported in July 2025 that Elliott Investment Management had accumulated a sizable position in Global Payments.
Its exact current ownership, intentions and any potential role in future corporate decisions should not be assumed without updated evidence.
Activist involvement may influence capital allocation or strategic priorities.
But neither activism nor the possibility of renewed takeover discussions establishes intrinsic value.
FRL interpretation: GTCR’s ownership structure and prospective liquidity events deserve monitoring alongside operating cash flow, rather than replacing fundamental analysis with speculation about shareholder intentions.
11. Bull, Base and Bear: What Would Validate the Investment Case?
BULL CASE — The cash-flow transition succeeds
Global Payments maintains or improves normalized revenue growth, realizes meaningful Worldpay savings and reduces transaction-related cash expenditure.
Adjusted and reported free cash flow move closer together as the integration progresses.
The company demonstrates that large annual cash generation is compatible with necessary technology investment and declining leverage.
The market gradually becomes more confident in the sustainability of the business and assigns greater value to its cash flows.
Confirmation: Consistently positive reported free cash flow, narrowing cash-flow adjustments, improving revenue quality and demonstrable debt reduction.
Invalidation: Continuing increases in recurring expenses, customer attrition or failure to translate projected savings into cash.
BASE CASE — Progress remains uneven
The company achieves moderate normalized revenue growth and delivers a meaningful portion of expected synergies.
However, continued integration spending and technology investment delay the convergence of adjusted and reported free cash flow.
Management retains financial flexibility, but investors demand evidence of stronger cash generation before assigning a materially higher valuation.
Confirmation: Stable underlying growth, gradual reduction in transaction-related outflows and slow but measurable deleveraging.
Invalidation: A decisive acceleration in cash conversion or significant deterioration in the operating business.
BEAR CASE — The costs of integration persist
Customer losses, competitive pricing, technology expenditure or implementation difficulties offset more of the expected integration benefits.
Reported cash generation remains disappointing, while debt reduction takes longer than anticipated.
Valuation pressure persists despite a seemingly attractive adjusted earnings multiple.
Confirmation: Sustained negative reported cash flow, weaker normalized revenue growth, deteriorating retention or a material delay in leverage reduction.
Invalidation: Visible normalization of cash generation and evidence of strengthening customer economics.
These scenarios are conditional analytical frameworks. No numerical probabilities or unsupported equity price targets are assigned.
12. WHAT CHANGES THE CASE?
Five developments deserve particular attention over the next several quarters.
| Variable | What would strengthen the thesis? | What would weaken it? |
|---|---|---|
| Cash-flow reconciliation | Reported and adjusted FCF converge as exceptional payments decline | Large adjustments persist without a credible end date |
| Normalized revenue and retention | Sustained growth with stable or improving customer economics | Slowing growth, merchant attrition or pricing pressure |
| Worldpay integration | Measurable synergies with disciplined spending and improving service quality | Integration overruns or savings offset by new recurring costs |
| Leverage and capital allocation | Progress toward 3.0× net leverage with shareholder returns funded by sustainable cash | Delayed deleveraging or distributions that constrain financial flexibility |
| GTCR ownership and financing conditions | Orderly ownership developments and manageable refinancing costs | Disruptive selling pressure or materially more expensive refinancing |
The next annual reporting cycle will provide an opportunity to examine how much of the current adjusted profitability is becoming recurring, economically usable cash.
The first half of 2027 should then provide additional evidence about whether the company’s operating model is stabilizing after the acquisition.
Conclusion: The Market Has Removed the Buyer, Not the Cash-Flow Opportunity
The November 12 decline followed the reported abandonment of preliminary private-equity acquisition discussions.
It was not accompanied by an announced operating earnings collapse.
The company’s third-quarter results demonstrate continuing normalized revenue growth, adjusted margin improvement and substantial adjusted cash generation.
These are genuine positives.
At the same time, the Worldpay combination has produced a complex financial profile involving substantial acquisition-related debt, transaction expenses, tax effects and continuing integration spending.
The negative reported cash flow of the third quarter must be interpreted in that context.
It is neither proof of a permanently impaired business nor a number that investors can simply disregard.
The central question is whether Global Payments can convert its operating scale and expected synergies into recurring cash available after necessary investment, while improving its financial position.
The company’s ambitious medium-term cash-flow objectives provide a measurable test.
The failure of the buyout has removed one possible route to a higher equity valuation.
The remaining route is more demanding, but ultimately more important: demonstrable economic performance.
Research Sources and Methodology
Primary sources
- Global Payments Q3 2026 earnings release, November 5, 2026 — reported operating results, guidance, margin performance and Worldpay synergy target.
- Global Payments September 30, 2026 Form 10-Q — GAAP financial statements, available liquidity, debt, cash flow, integration and financing disclosures.
- Global Payments June 30, 2026 Form 10-Q — six-month cash-flow data used to calculate third-quarter amounts.
- Global Payments January 2026 Form 8-K — Worldpay completion, GTCR shares and shareholders agreement.
- Global Payments SEC Form 13G concerning GTCR — beneficial ownership disclosure.
Contemporary reporting and management commentary
- Reuters, November 12, 2026 — withdrawal of CD&R and GTCR from preliminary acquisition discussions.
- Reuters, October 30, 2026 — original takeover reporting.
- Global Payments Q3 2026 management earnings-call transcript — adjusted free cash flow, conversion, capital returns and deleveraging commentary.
- Global Payments Q4 2025 earnings-call transcript — previously communicated medium-term free-cash-flow expectations.
- Bloomberg, July 15, 2025 — reported Elliott investment.
Methodology: All third-quarter GAAP cash-flow figures identified as derived are calculated from the difference between the nine-month September 30 and six-month June 30 SEC cash-flow statements. Illustrative net-debt and enterprise-value figures are FRL analytical calculations, not management-defined measures. Medium-term targets are identified as management expectations rather than confirmed outcomes.
WIEDER WAS GELERNT
The most transferable lesson from Global Payments is that a dramatic gap between adjusted and reported cash flow is not, by itself, evidence of either financial weakness or aggressive accounting.
It is an invitation to investigate timing.
A company undertaking a major acquisition may report strong recurring operating performance while absorbing large, temporary cash payments. A different company may report the same divergence because its recurring costs are systematically excluded from adjusted results.
Conventional analysis often misses this distinction because adjusted earnings and GAAP cash flow are treated as competing verdicts rather than different views requiring reconciliation.
The correct approach is to reconstruct the cash-flow bridge, identify the economic character of each adjustment and test whether the reported figures converge as management’s timetable advances.
This discipline becomes particularly important when substantial debt and shareholder distributions compete for the same cash.
It applies not only to payment processors, but also to infrastructure businesses, acquisition-driven consolidators and companies undergoing major restructuring.
The quality of an earnings forecast is ultimately revealed by the cash it produces—and by when that cash becomes available.
Disclaimer
This publication contains general financial-market and investment research for informational purposes only. It does not constitute investment or financial advice, portfolio management, or a recommendation to purchase, hold or sell any financial instrument. Market data and forward-looking statements may change, and estimates or scenarios are not guarantees of future performance.